Data looping is a systematic way to collect information, pull out insights and put those insights into motion. In this process, companies design systems to gather data and model, mine, aggregate, and visualize the insights obtained. Similar to a feedback loop, this process is ongoing.
")
The 7 Stages of Data Looping
There are seven core steps to a data loop that require various key players
throughout the organization.

")
Data Looping for a Better Customer Experience
By simply gathering data without closing the data loop, big data stays just that — big. Data looping puts the processes and the right people in place to extract meaningful insights around key every point in the customer’s journey.
Data looping is a strategy that’s used to help teams know which growth levers to push and pull in the organization. By offering deep insights into the motivations and behavioral patterns of both employees and customers, teams can pinpoint the exact areas where value is provided from an emotional and logical point of view.
In getting down to the root-cause analysis of what’s happening, brands are equipped to deepen their understanding around the contiguous customer journey and overarching purchase behaviors. This wider perspective allows companies to monetize initiatives with less risk and more reward.
Data Looping Requires the Right People Steering the Ship
Each key player in the data looping must collaborate with other roles or departments for insights to be gleaned and the process to be leveraged strategically.
These players must start by working together to design and craft content for the various data collection methods used. Once deployed, you must have a systems administrator and software engineer in place to handle the technical aspect of the deployment.
A data scientist can then aggregate all of that data from the various sources and move it to the mining and modeling phase for correlation analysis or regression analysis.
Collectively, teams will work together to validate the information gathered and draw insights from the findings.


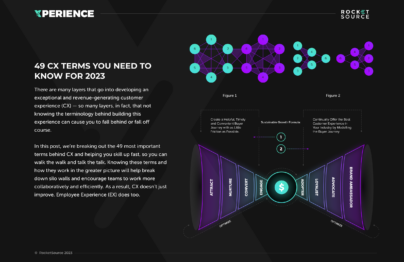
Closing & Visualizing the Data Loop
Collecting data for the sake of data collection spells trouble. Rolling data back in and closing the data loop is key to gleaning in-depth insights. These insights must then be dispersed across the organization to keep teams moving together in harmony towards the same end goal with the same information.
Visualize data to extract actionable, humanized insights, ensures you’ll get some kind of return on that investment.
From gaining team buy-in to spotting patterns before they become costly for the organization, teams benefit from closing the data loop with visuals that can be democratized across the organization.
The Big Four of Data Looping: Volume, Velocity, Variety, Veracity
Businesses today are facing a distinct, widespread problem — inconsistent, incomplete, and nebulous data sets can lead to biases, bugs, disparity, elusiveness, falsification, and human error, making it harder for organization to innovate at a rapid pace. These four areas help overcome those risks and challenges.

Volume
DATA AT REST
Terabytes to exabytes of existing data to process.

Velocity
DATA In Motion
Streaming data milliseconds to seconds to respond.

Volume
Data in Many Forms
Structured, unstructured, text, multimedia

Velocity
DATA In Doubt
Uncertainty due to data inconsistency & incompleteness, ambiguities, model approximations
Customer Experience (CX) Terms
- 360° Degree View of the Customer
- AI Ops
- Barlow Bands
- Behavioral Triggers
- Bow Tie Funnel
- Brick-to-Click
- Business Impact Analysis (BIA)
- Cognitive Computing
- Cohort Analytics
- Content Mapping
- Conversational User Guidance
- Customer Data Profile
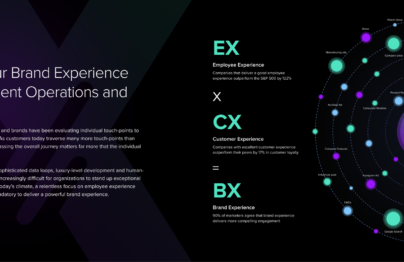
- Customer Experience (CX)
- Customer Friction
- Customer Insights Map
- Customer Journey
- Customer Journey Mapping
- Customer Satisfaction (CSAT)
- Customized Ratios
- CX Intelligence
- CX Led Growth
- CX Metrics
- Data as a Product (DaaP)
- Data as a Service (DaaS)
- Data Culture
- Data Driven
- Data Engineering
- Data Fabric
- Data Governance
- Data Humanization
- Data Hygiene
- Data Looping
- Data Mapping
- Data Mining
- Data Modeling
- Data Monetization
- Data Swamp
- Data Visualization
- Data Warehouse
- Data-Centric
- Descriptive Analytics
- Diagnostic Analytics
- Digital Asset Management (DAM)
- Digital Transformation
- Dirty Data In Dirty Data Out
- Embedded Intelligence
- Empathy Mapping
- Employee Data Profile
- Employee Experience (EX)
- EX to CX Data Mapping
- EX to CX Mapping
- Experience Management (XM)
- Gap Analysis
- Generative AI
- Human-Centered Design (HCD)
- Journey Analytics
- Machine Learning (ML)
- Managed Agile Services on Demand
- Modified Hoshin
- North Star Metric
- Party Data
- Pathway to Purchase
- Predictive Analytics
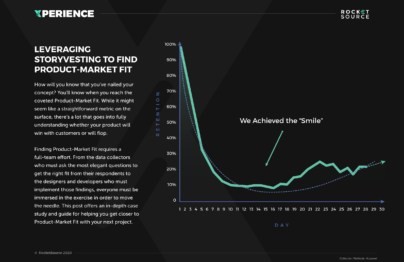
- Product-Market Fit Mapping
- Real Time Design Looping
- Revenue Acceleration
- RevOps
- S Curve of Growth
- Stack Impact Analysis
- StoryVesting
- Table Stakes Testing
- The 3 P’s
- User Experience (UX)
- User Insights Map
- User Interface (UI)
- Voice of the Customer (VoC)
- Voice of the Employee (VoE)
- World Cloud Generator Sentiment Mining
- X Analytics