Transforming the Digital Experience via Customer Journey Mapping
Ah, the good ol’ Customer Journey Mapping exercise. Is it still a method you can leverage to create incredible digital experiences, or has it become overused and shallow, feeling more like exaggerated fluff than substantive intelligence? The answer isn’t a simple one. It really depends on how robust the framework is that you’re using, how detailed the journey map is, how many departments actually participate in the exercise, how your team leverages the narrative for the initiatives you’re running, and how sophisticated your team is at building intelligence from the data contained inside and outside of the map.
Yep, it can get complicated very quickly.
But look, I think we all understand that customers’ journeys and decision-making processes are difficult to capture, analyze, and decipher in a manner which allows for informed decisions. Even with the sophisticated technologies at our disposal today, we need a human element to successfully draw insights from customer behavioral analysis. Still, many organizations view new technologies, such as deep learning or artificial intelligence (AI), as a silver bullet for catalyzing innovation and optimizing systems and processes organization-wide, thereby stripping away the benefits of analysis by the human brain. This lack of infusion of a human element begs the question — who’s driving the ship? Are we relying on machines to make critical decisions without a framework or strategy?
Well, buckle up, campers! I’m going to start light and then dive in deep while covering varying terrain. This “varying terrain” will be tangentially associated with the core idea of using Customer Journey Mapping as a foundational exercise and framework for building out, analyzing, and connecting more intelligent and technical elements to your business.
By the end of this post, I’m hopeful you can answer the question above with confidence that YES, customer journey mapping is a method which can create incredible digital experiences.
But first…
When Did the Need for More Sophisticated Customer Journey Mapping Arise?
Throughout my career, I’ve had the good fortune to work with and advise some of the most forward-thinking brands and teams. Also, through this work, I have witnessed how — through careful strategic planning and master-level tactician execution — companies of all sizes have been able to carve out top-of-mind brand relevance. Through this work, during many hours spent each night consuming content — lately through my fav Apple News feed — I have solidified something significant:
Success isn’t accidental. It happens by pushing the limits on understanding the employee and customer experience.
As evidence of this notion, just look at what some of today’s leading brands are doing. Netflix, Amazon, and plenty of other organizations have changed the competitive landscape, setting new standards for experience initiatives by using sophisticated customer insights and analytics. Those companies get an insightful picture that is so complete, so woven into the fabric of the organization’s operations, that it’s obvious why they are consistently on top of the leaderboard. They take the bull by the horns, doing the hard work of leveraging predictive technologies to deliver personalized recommendations and drive digital transformation initiatives by focusing on the digital experience. As a result, they are successfully building anticipatory services instead of reactive ones, catapulting all of us into an era of more intelligent operations and smoother customer experiences. These new rules are challenging all organizations to up their ante to be competitive, effectively ratcheting up the standards for engaged digital experiences.
Today’s consumers don’t go easy on brands of any size. Customers expect heightened levels of service and a sublime experience from every business interaction across their entire journey. To compete in today’s modern ecosystem requires that organizations know what’s happening along the many journeys taking place at any given time, and then meet their customer at just the right time with just the right deliverable. It’s worth noting the plural usage of “journey,” because every customer, regardless of cohort, follows both a path-to-purchase AND a path-to-loyalty. To cultivate and harvest meaningful insights across both journeys requires that organizations leverage a customer journey map that is expansive, thorough, consumable, and can serve as a foundation for intelligent operations. In other words:
Effective Customer Journey Mapping exercises aren’t for the faint of heart.
Sure, driving digital transformation with journey mapping isn’t easy, but it is vital if you want to meet the modern consumer’s expectations head-on. Sound daunting? It is. There’s just no sugarcoating it. However, it’s also necessary, which is why I’m excited to finally, finally unveil the most intelligent journey analytics protocol and customer journey map to date — the Customer Insights Map — an asset designed to lay the foundation for your intelligent operations, digital transformation, and experience initiatives. Before I get too far ahead of myself, let me lay the groundwork to explain why this map matters so damn much and how it came to life.
Building a Layered, Intelligent Operation via Customer Journey Mapping
I’m going to ask you a hard question. How relevant is your brand to today’s modern consumer? If you’re like many of the professionals I talk to, you want to believe that it is but are painfully aware that staying relevant in such a fast-paced environment is challenging beyond belief. Yet, relevancy is crucial in today’s highly competitive climate. It demands that organizations understand what’s happening along the buyer’s journey to know when, where, and how to make a grand entrance. That understanding starts by gathering data and running an intelligent operation.
If you’re not familiar with what intelligent operations entail, take a look at this definition from the good guys at Genpact:
“Intelligent operations are those which harness diverse data driven by applied intelligence and human ingenuity to empower insight-led decision making, superior customer experiences and breakthrough business outcomes.”
Using intelligent operations to deliver best-in-class customer experiences takes a level of forethought and analytical rigor, which often feels flat-out daunting as you strive to converge combinatory systems or optimize front and back-office operations. Most people I’ve talked to in recent years tend to think that using intelligence to create machine learning algorithms and predictive models is rigorous, difficult and completely outside the purview of anyone outside of the data department. The fact is, it’s not as difficult as you might think.
About 75% of the way through this post, you’ll get a chance to watch and listen to our Vice President of Data Science, Cassidy Hilton in action. He’ll talk about how the data office can use the front line effects of marketing to build sublime experiences and feature sets thereby increasing UX/UI experience score, reducing Customer Effort Scores (CES), increasing Customer Satisfaction (CSAT) scores, Net Promoter Scores (NPS), and more. Typically these scores are kept in silos, which can limit the ability of other departments to see and understand what’s happening along the buyer’s journey, and cause departments to lose sight of what’s needed to iterate, innovate, and grow. In taking this intelligent approach, regardless of whom we’ve worked with or where they fall on the digital maturity spectrum, we’ve seen cross-departmental alignment answer the ultimate critical mission of staying relevant. That relevance starts by enriching the talent pool and dropping silo walls so everyone starts speaking the same language.
Staying Relevant Starts Internally
I’ve talked before about the importance of building a V-Shaped team when driving organizational growth via digital transformation; I’ll address it briefly again here because it really is that important. The first step toward building a more intelligent operation is building V-Shaped teams, which can communicate across multiple departments regardless of background or skillset.
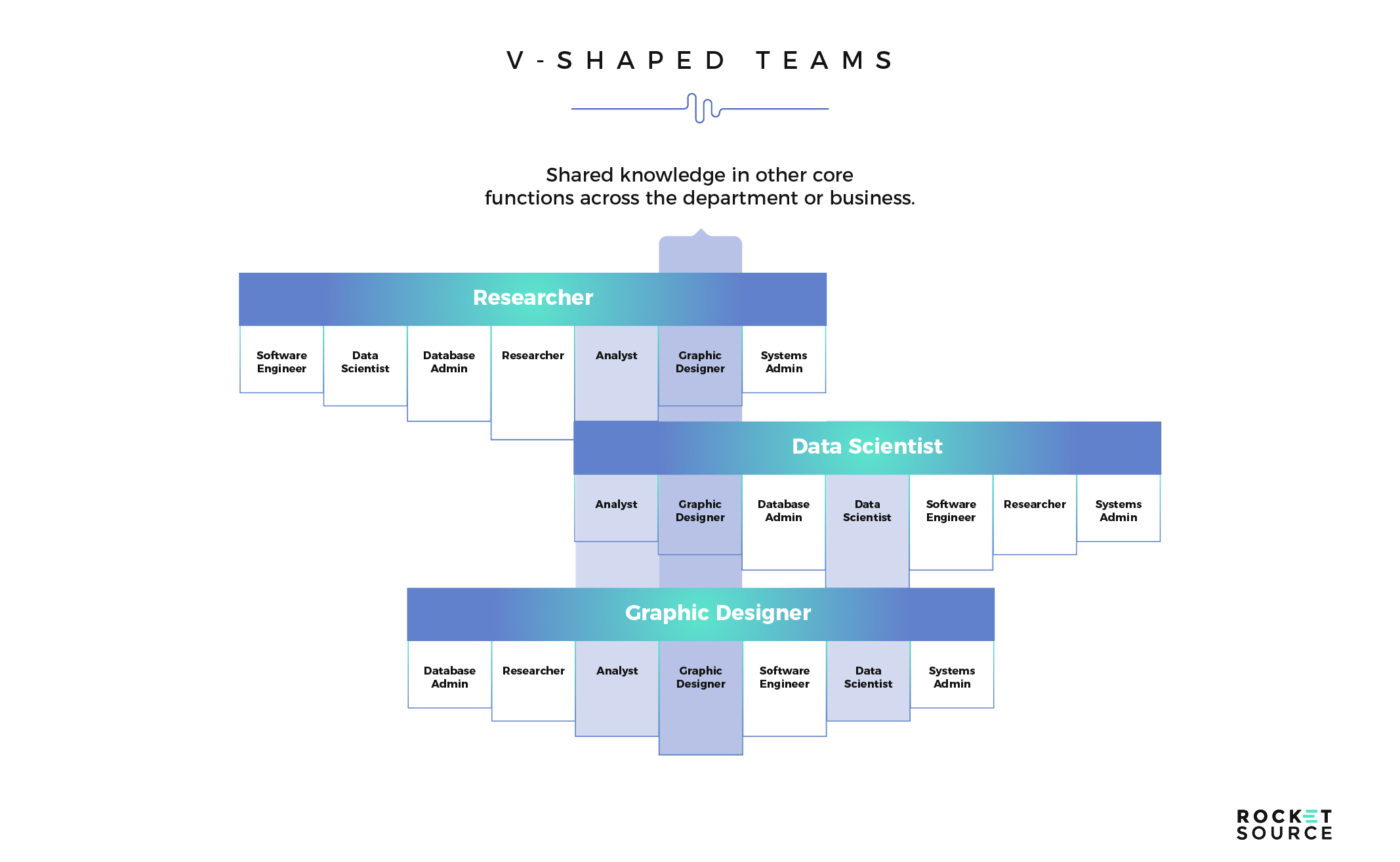
With V-shaped employees on board silo walls start to tumble down, empowering everyone to communicate more effectively, and organizations to move more quickly and competitively. It’s not enough anymore just to produce amazing campaigns, banner ads, or funnels and expect to stand out. An intelligent operation goes well beyond gut-checking decisions against limited data sets. To be a leader in your industry requires V-shaped teams to communicate clearly with one another while applying human logic and empathy to the insights gleaned.
That requisite human touch should be music to everyone’s ears, especially because so many jobs, including the job of the data scientist, are at risk of being automated. Adding human logic and empathy to intelligent business operations requires teams to skill up to the point where they can at least understand the opportunities presented by modern technologies. To drive this point home, look at how many traditional jobs are poised to change over the coming years.
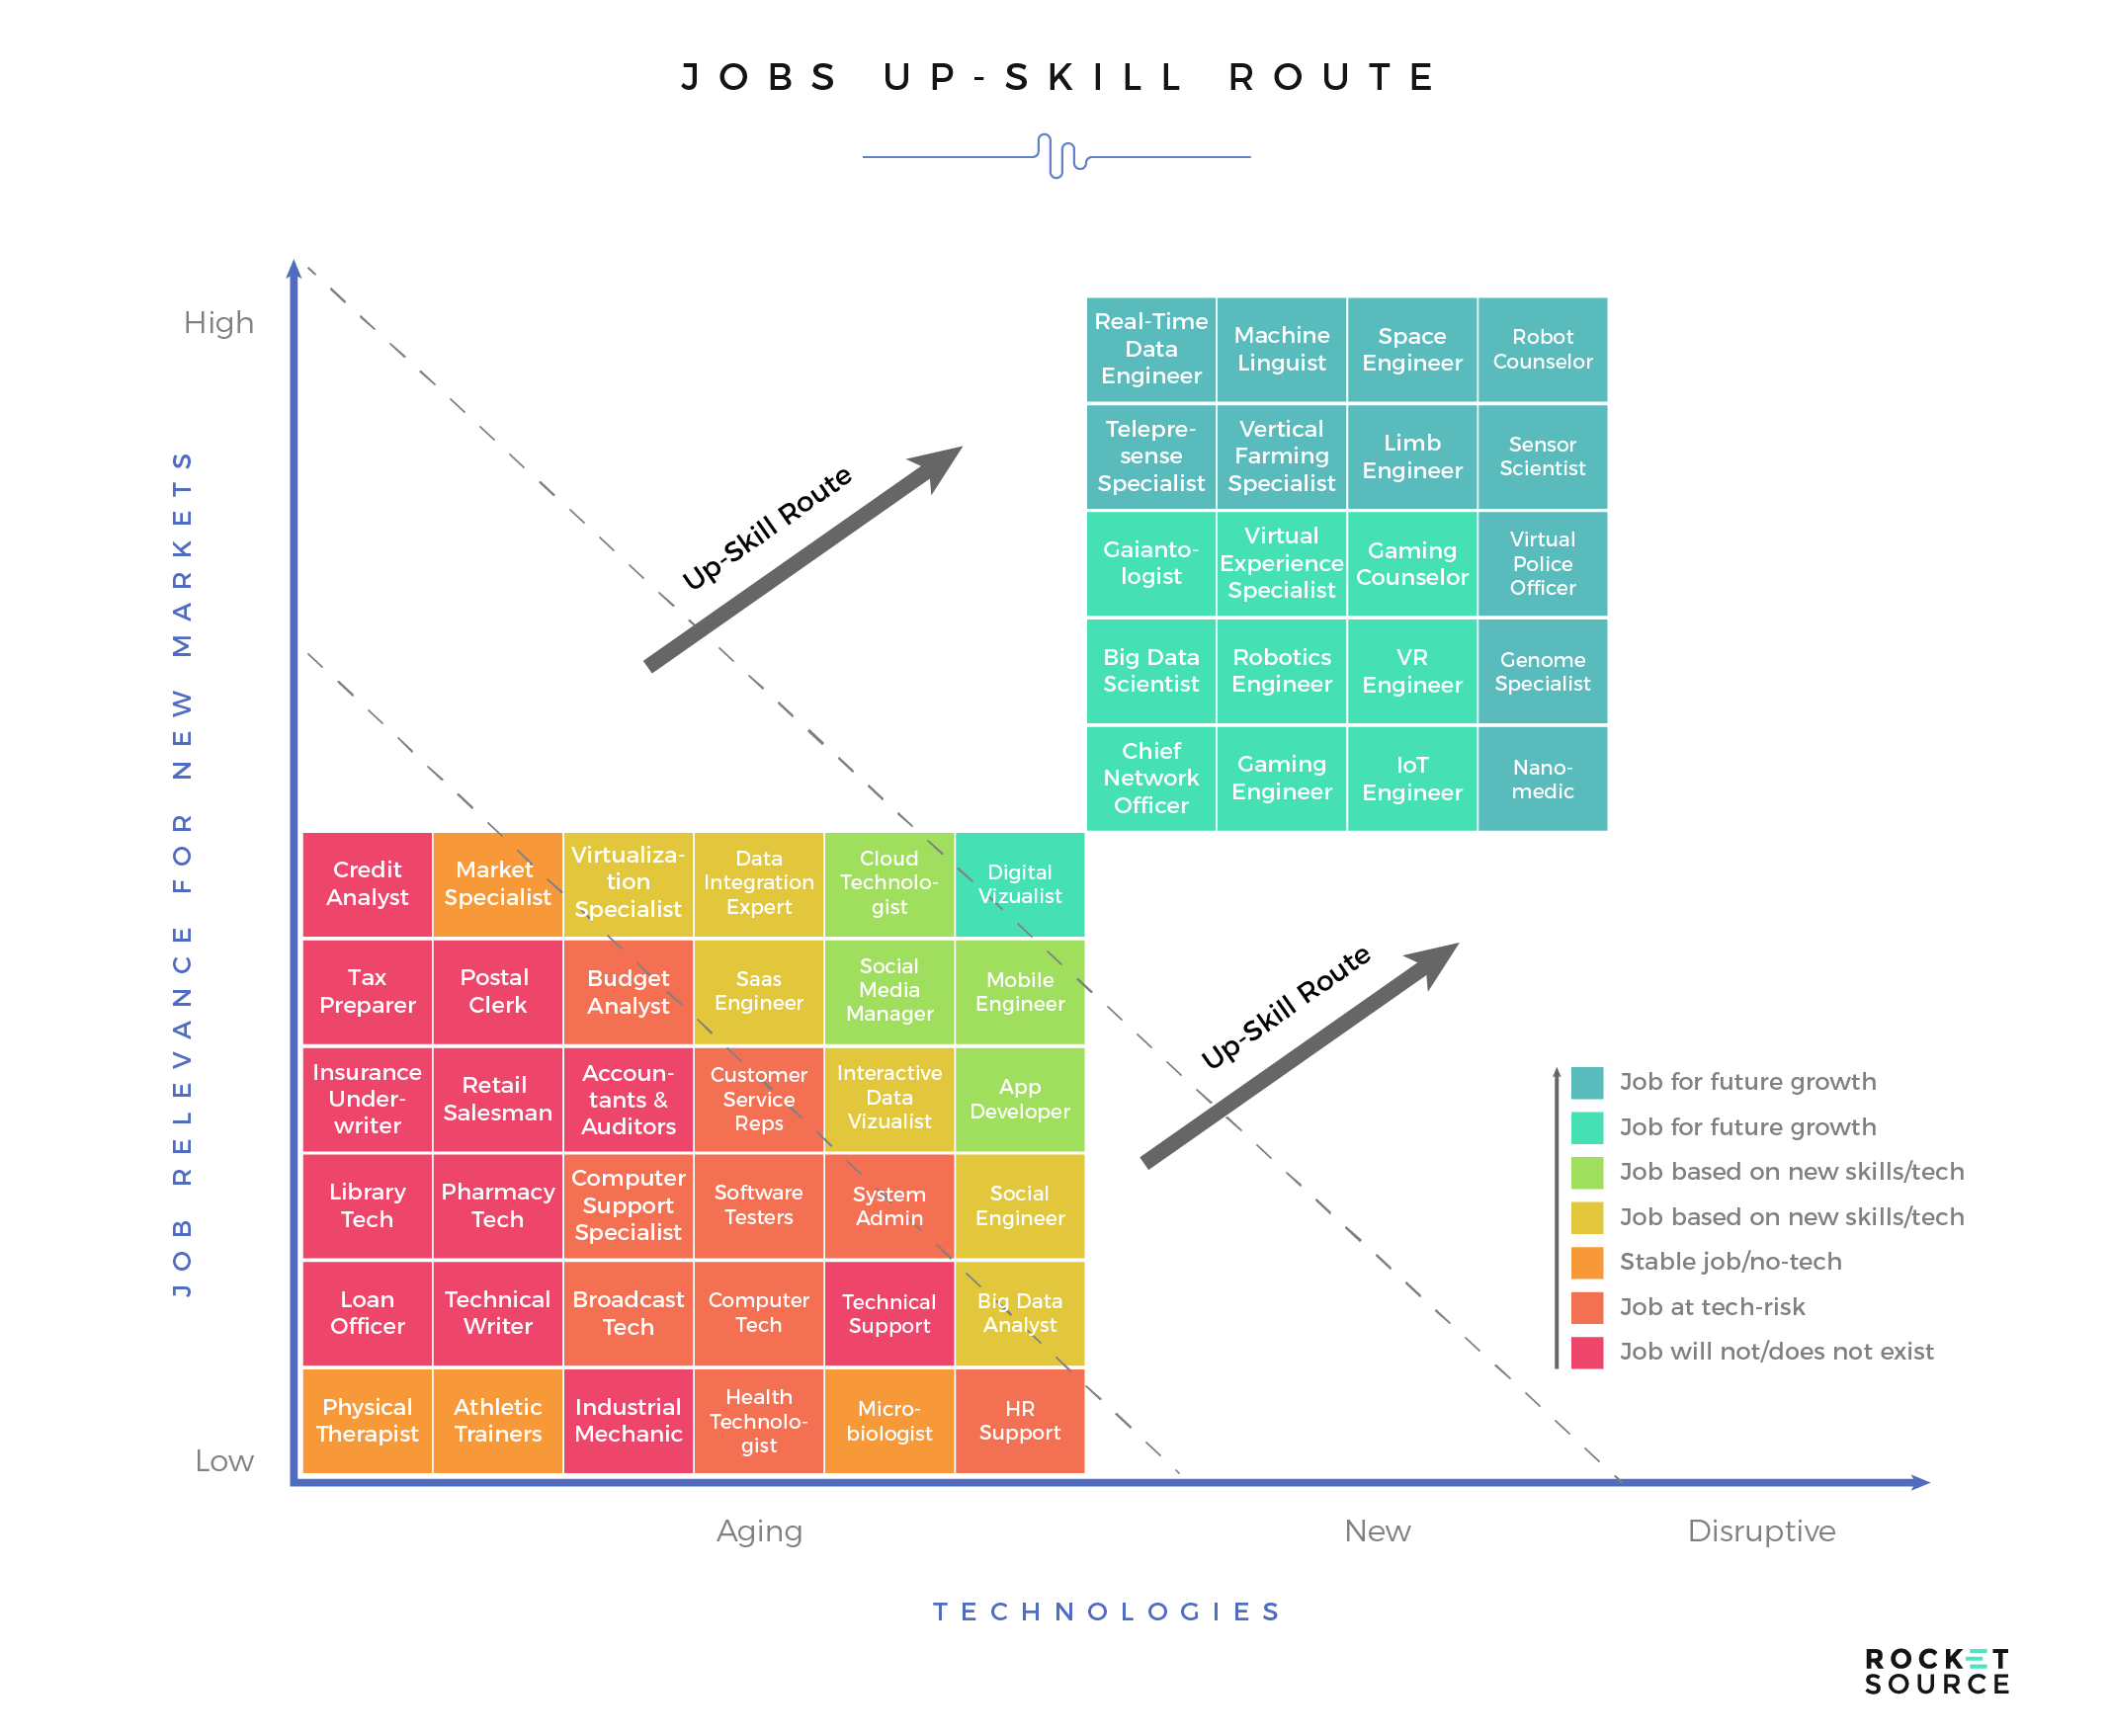
The skills gap is widening as we evolve to a more intelligent way of operating. The responsibility of narrowing that gap lies on the shoulders of the workforce and the organizations which hire them. Companies must provide the opportunity to build a pool of talent which will help them run an operation driven by insights and extracted from sophisticated informational architecture by way of digital economies of scale. It’s through a sophisticated team that you are better able to convey meaningful information across the organization while catalyzing innovation and earning the attention of your target customer. Still, many organizations don’t do the heavy lifting to gain the type of insights needed. Instead, they hobble along, hoping their assertions, based on minimal data and various amounts of experience, are accurate enough to stay on course.
It’s Dangerous to Try to Preconceive the Modern Customer Journey
Ever since I was a kid, I’ve loved figuring out how to make complex problems easier to understand. From an early age, I’d tinker around in an attempt to figure out how to make things more efficient. Over time, that love for coming up with answers to the unknown plus a passion for constantly innovating led me down a path toward consulting. Today, I thrive on solving some of the biggest problems facing organizations today by using models built on behavioral psychology, macroeconomic theory and a slew of other critical methodologies. The goal in doing all this deep digging is to determine why consumers choose ABC path versus XYZ path, which requires taking a predictive stance to develop an anticipatory service.
The traditional approach organizations have taken to the customer journey doesn’t do the buyer justice. Instead of honoring the behavioral psychology and deep neurological complexities associated with what happens when a person makes a decision, organizations typically pushed buyers through a funnel in a linear fashion. The process looked something like this:
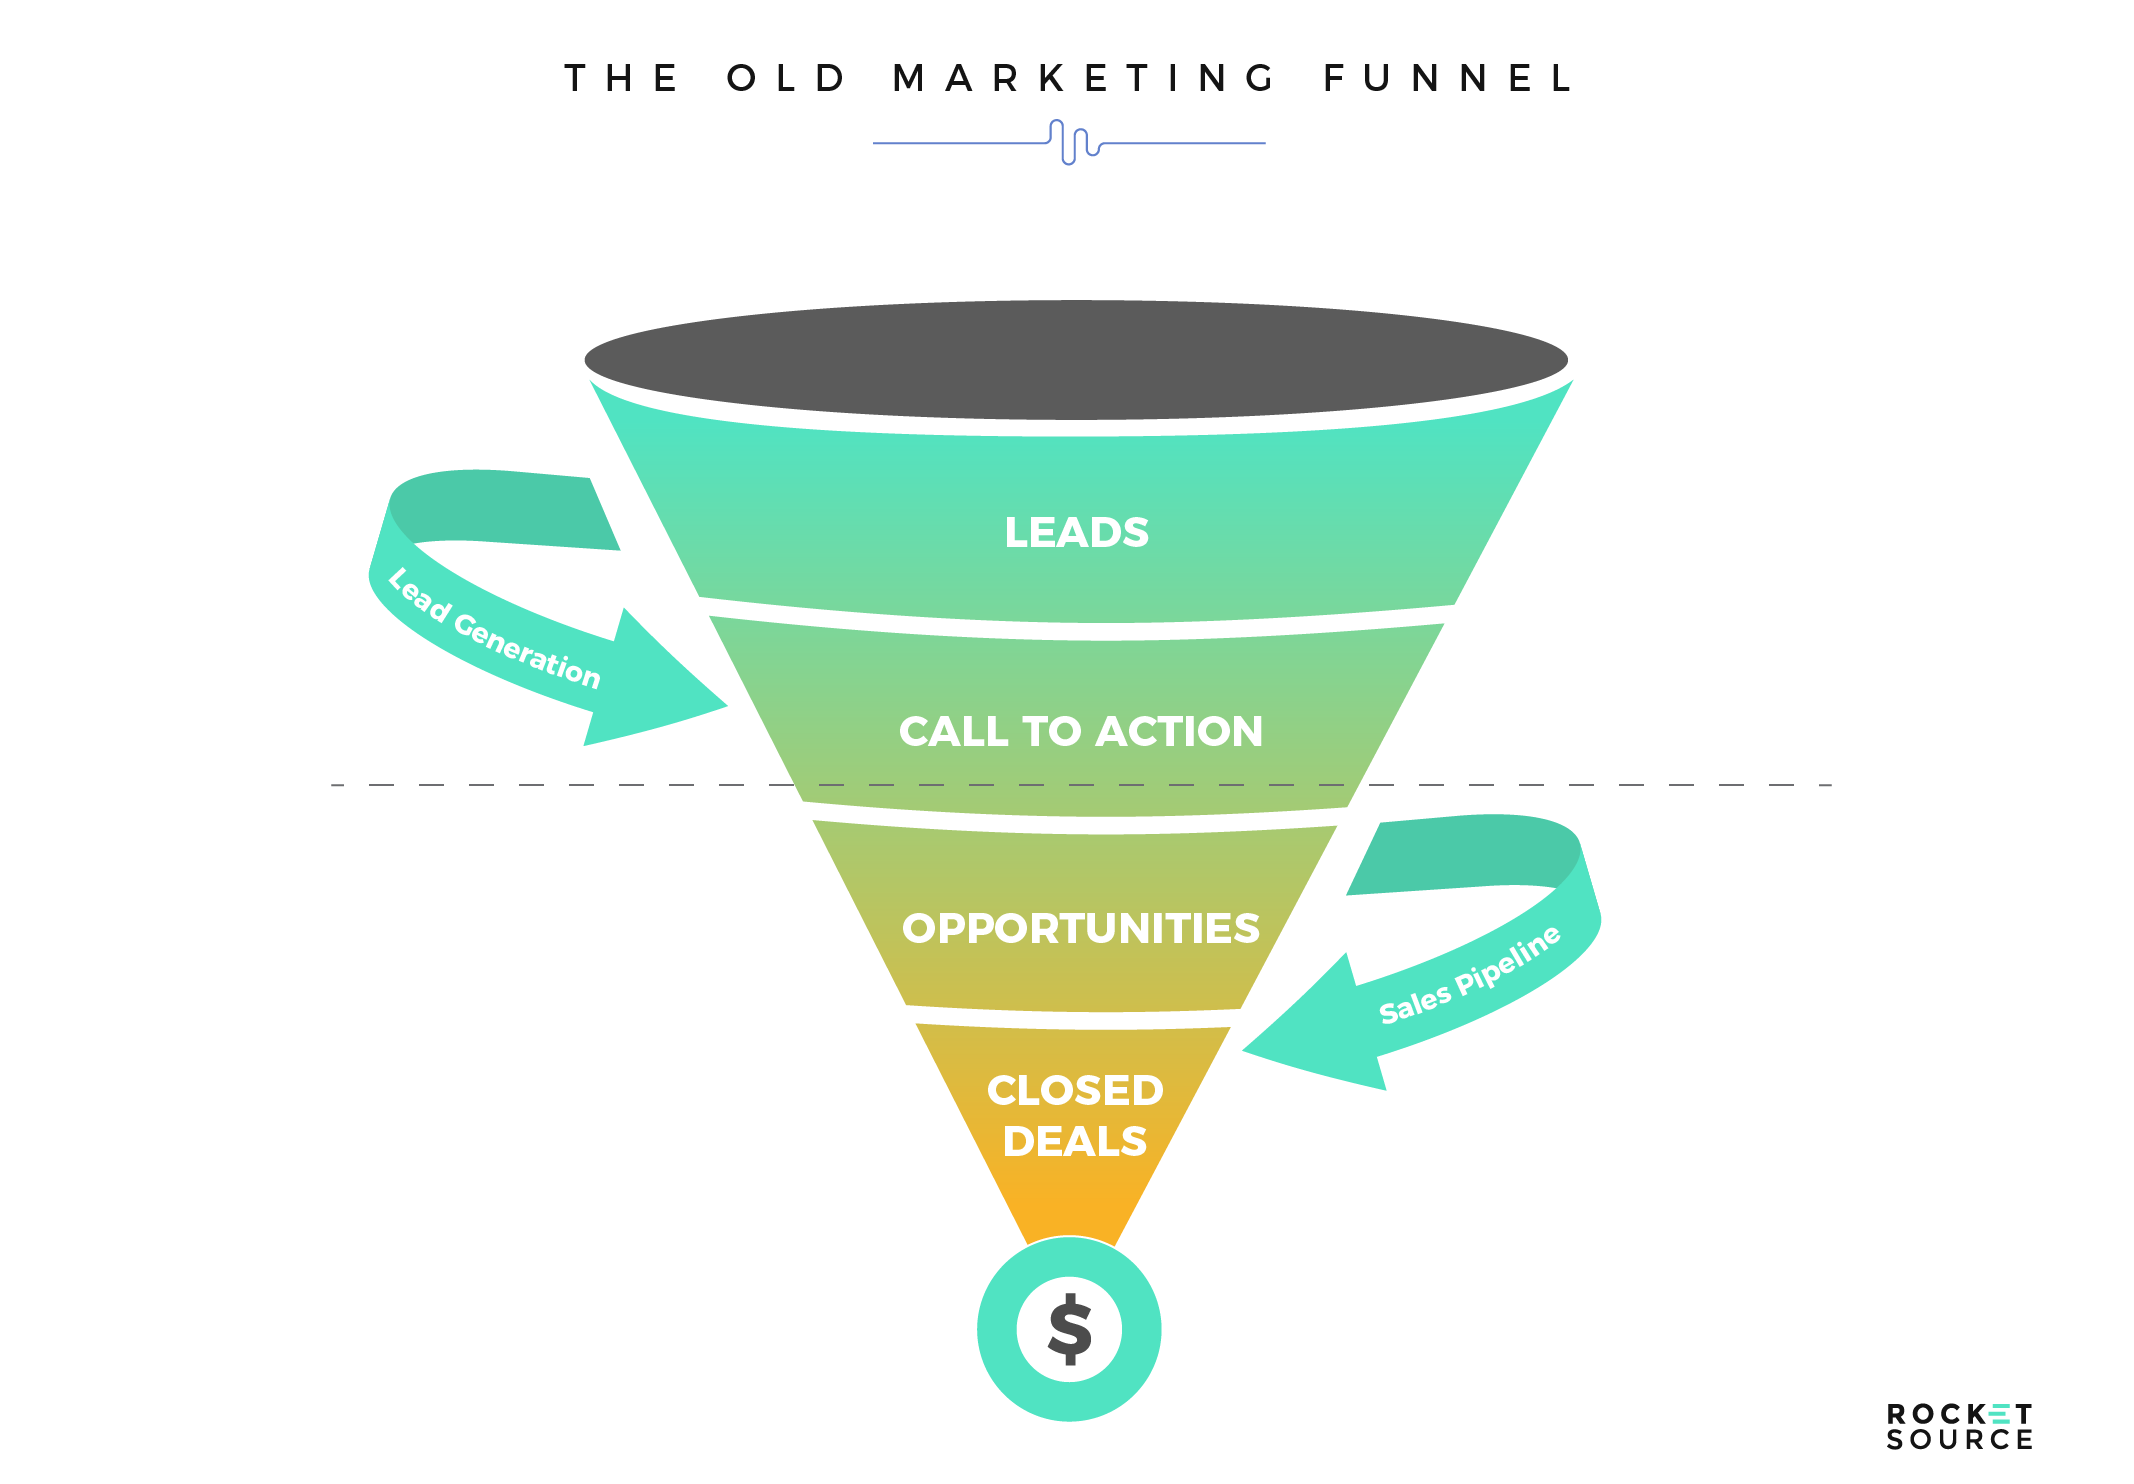
Look familiar? In this traditional funnel, pushing as many leads as possible into the top of the funnel was the marketer’s job. As soon as they were in, the consumers were conveyor-belted along their journey until they were handed off to a member of the sales team to finalize the transaction. The process of this funnel doesn’t just feel disjointed for the end consumer; it also feels mechanical and transactional for the employees involved. This funnel is responsible for causing one of the most notorious silo walls — the one between the sales and marketing teams — to build sky-high. Harvard Business Review determined that when sales and marketing aren’t aligned, both suffer. Both employees and customers struggle to connect, which ends up robbing everyone of a sublime experience.
A poor experience stifles growth. One way to tear down these walls in a Reagan-like capacity involves creating mechanisms to properly bring customer insights to all team members, across all departments. This is something I, along with our Vice President of Data Science & Analytics, Cassidy Hilton, go in-depth on in our most recent post addressing organizational growth via digital transformation. This post garnered quite a bit of attention, which looking back, isn’t surprising given the fact that many organizations struggle to reach customers because data and insights regularly get locked up in individual departments. Making insights from customer journey analytics pervasive across your organization will allow you to utilize a less mechanical process and drive a more intelligent operation.
Today’s customer doesn’t have to be shunted through a funnel anymore. Technology has empowered the buyer to put themselves square in the driver’s seat of their own purchase decisions and get choosy about which brand to work with based on experience alone.
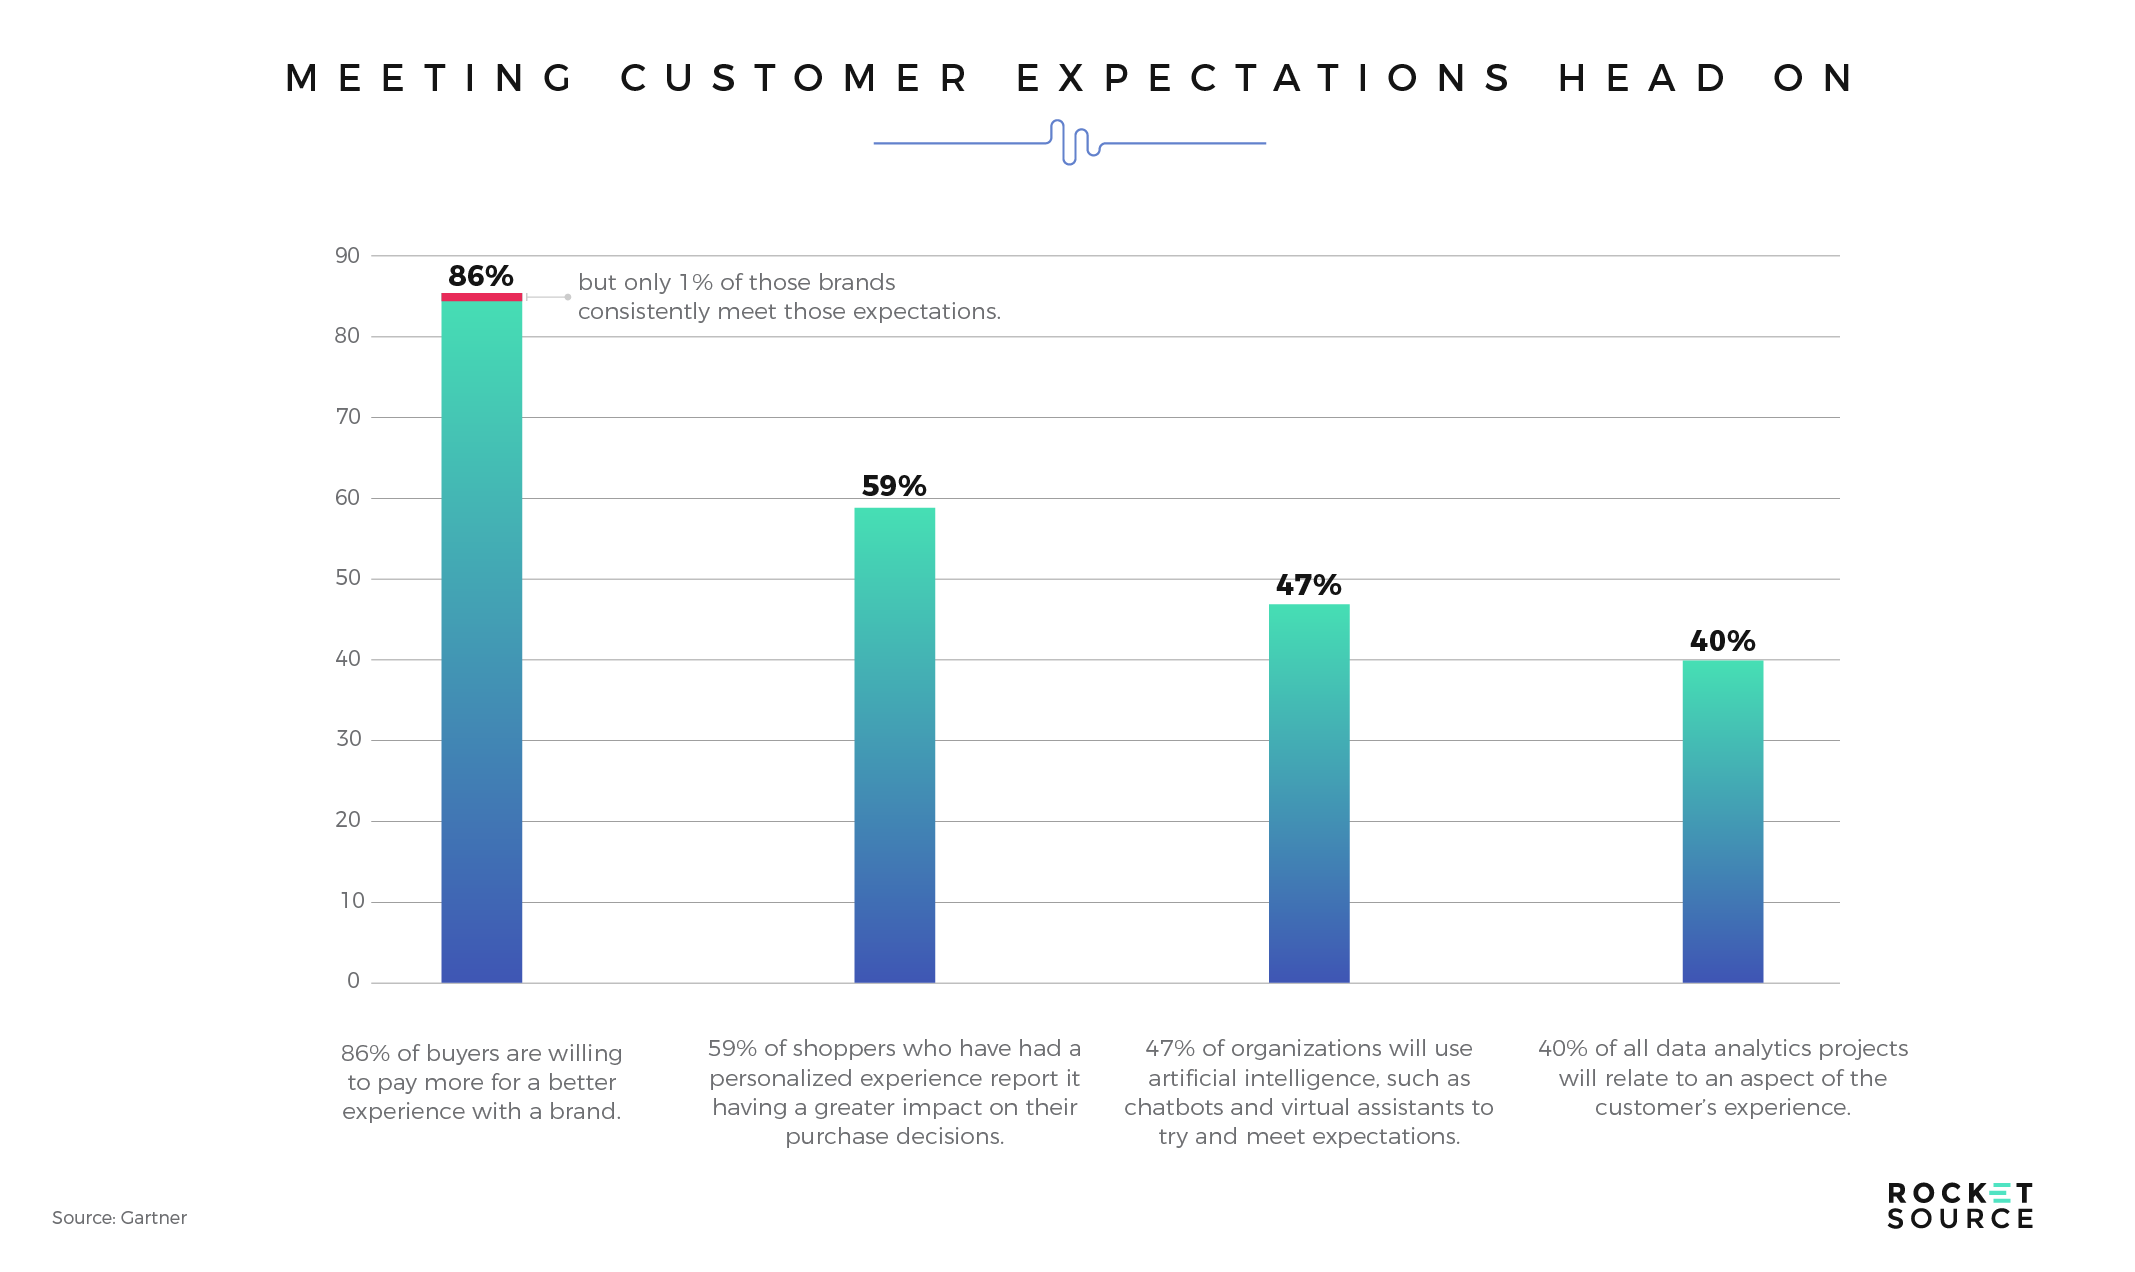
Oracle’s Customer Experience Impact Report determined that 86% of buyers are willing to pay more for a better experience with a brand, but only 1% of those brands consistently meet those expectations. That’s a big miss considering that, according to Infosys, a whopping 59% of shoppers who have had a personalized experience report a greater impact on their purchase decisions. To try to meet the modern consumer’s elevated expectations and desire for more personalization, 47% of organizations are stepping up their game, using AI mechanisms such as chatbots and virtual assistants, to try to answer the buyer’s desire for instant gratification. Another 40% of all data analytics projects will relate to an aspect of the customer’s experience, according to Gartner.
It’s not just the recognition of modern consumer behavior justifying these investments either. Forrester’s research on the economic impact of experience management found:
Organizations considered CX leaders outperformed laggards on the S&P 500 index by nearly 80%.
The Bow Tie Funnel Leads into the Customer Journey Map
Remember what I said earlier — leading brands today are in the top spots because of their relentless focus on delivering a more cohesive experience at each stage of and across the buyer’s journey. To deliver that experience, these organizations know they must embrace the notion that the modern funnel isn’t what many once believed it to be. Today’s modern “marketing funnel” is split between pre- and post-purchase paths, looking a little more like this:
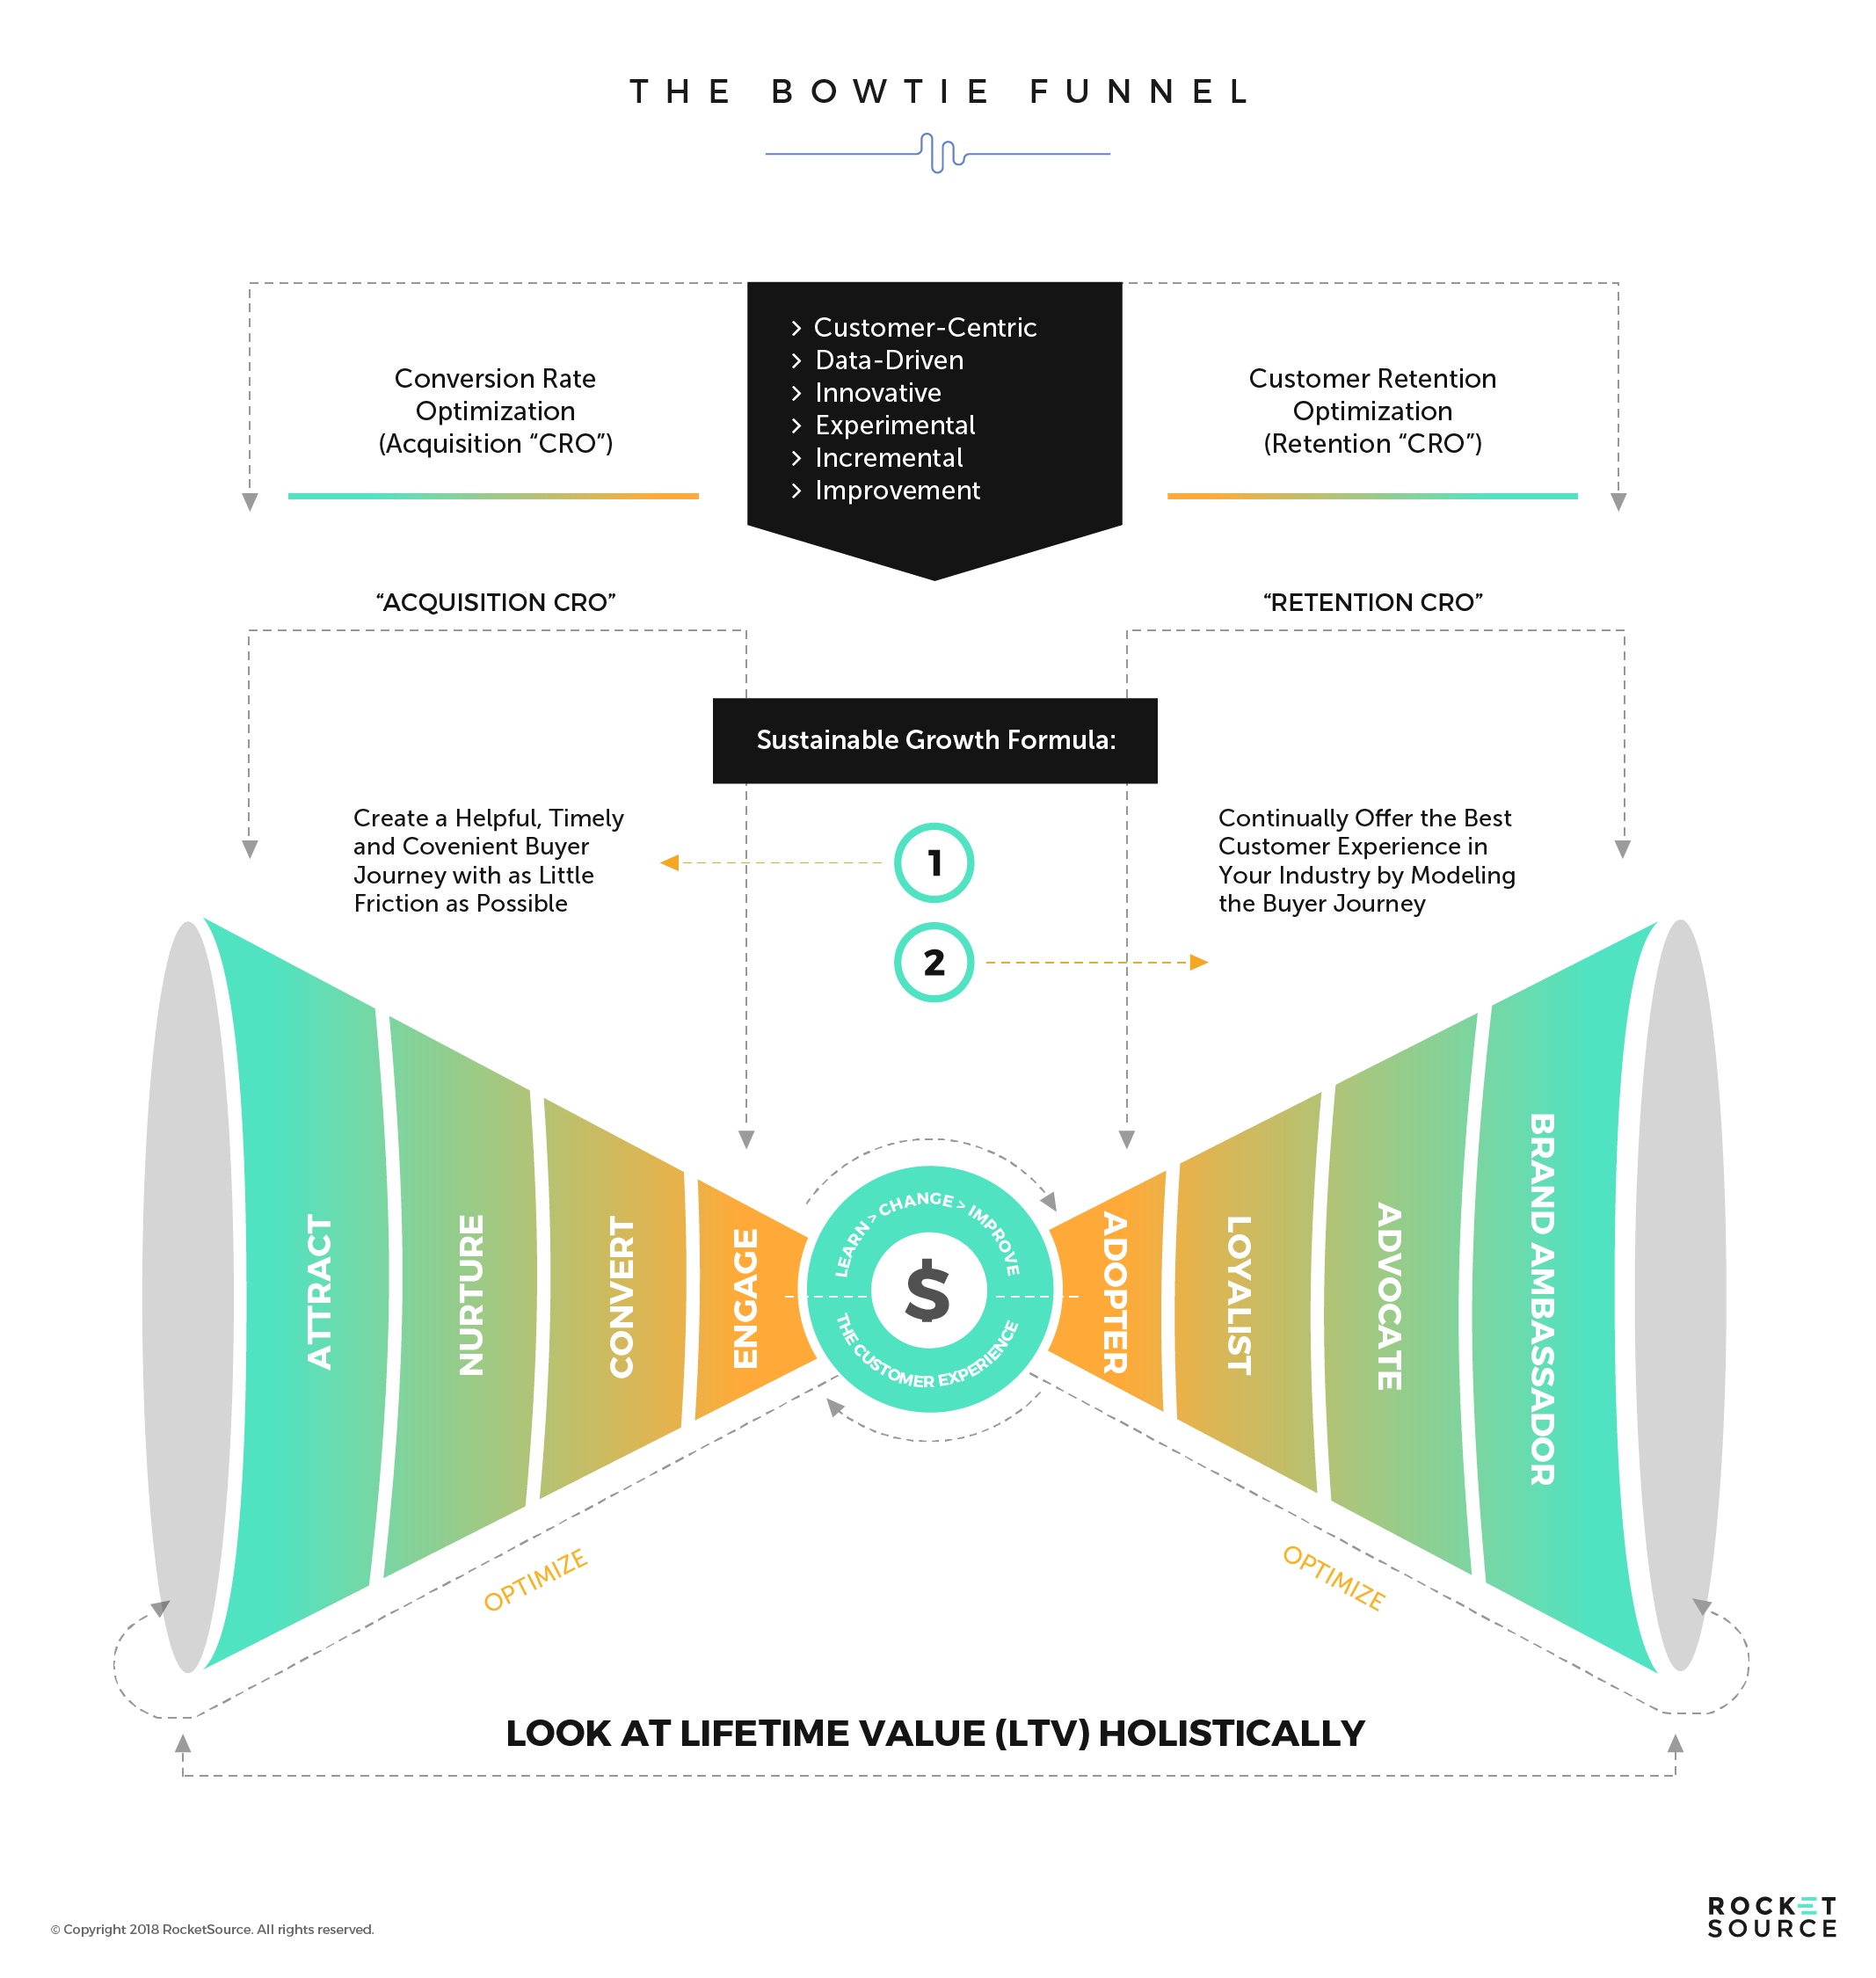
I call this the bow tie funnel for obvious reasons. It’s a representation of how customers today interact with brands today before, during, and after purchase. I’ve talked about this style of customer journey funnel before so I won’t go into tremendous detail again. For the sake of this post, here are the core differences you should know.
- The bow tie funnel doesn’t leave customers hanging after the point of purchase. Every stage of the funnel matters.
- The post-purchase nurturing of the consumer is equally as built-out and necessary as pre-purchase, signaling the importance of continuing to deliver a sublime experience even after the buyer has handed over their credit card.
- There’s no starting point and ending point. Instead, it’s a continuous loop of nurturing the customer toward continual engagement with your brand, which is critical to boosting retention and increasing the lifetime value of the consumer.
These defining factors of the bow tie funnel help drive incremental growth while building a more sophisticated operation via deep analytics, predictive models focusing on loyalty loops, conversion optimization strategies, attrition rates and more. Rolling data out of silos and disseminating across the organization via sophisticated technologies lets you tell a stronger story with confidence at every stage of the funnel — especially when bringing initiatives up to the C-suite. As evidence of what this approach can do, let’s look at China’s rapidly growing app, Pinduoduo.
Pinduoduo is a service which connects consumers to manufacturers in a vastly different way than traditional shopping methods. The app gathers customer-centric data about the buyer’s preferences and needs and then plays matchmaker, pairing buyers with manufacturers. This approach flips the traditional shopping method on its head, letting customers make the first move when they’re ready. That model has proven successful, driving substantial growth and high retention rates in a short period.
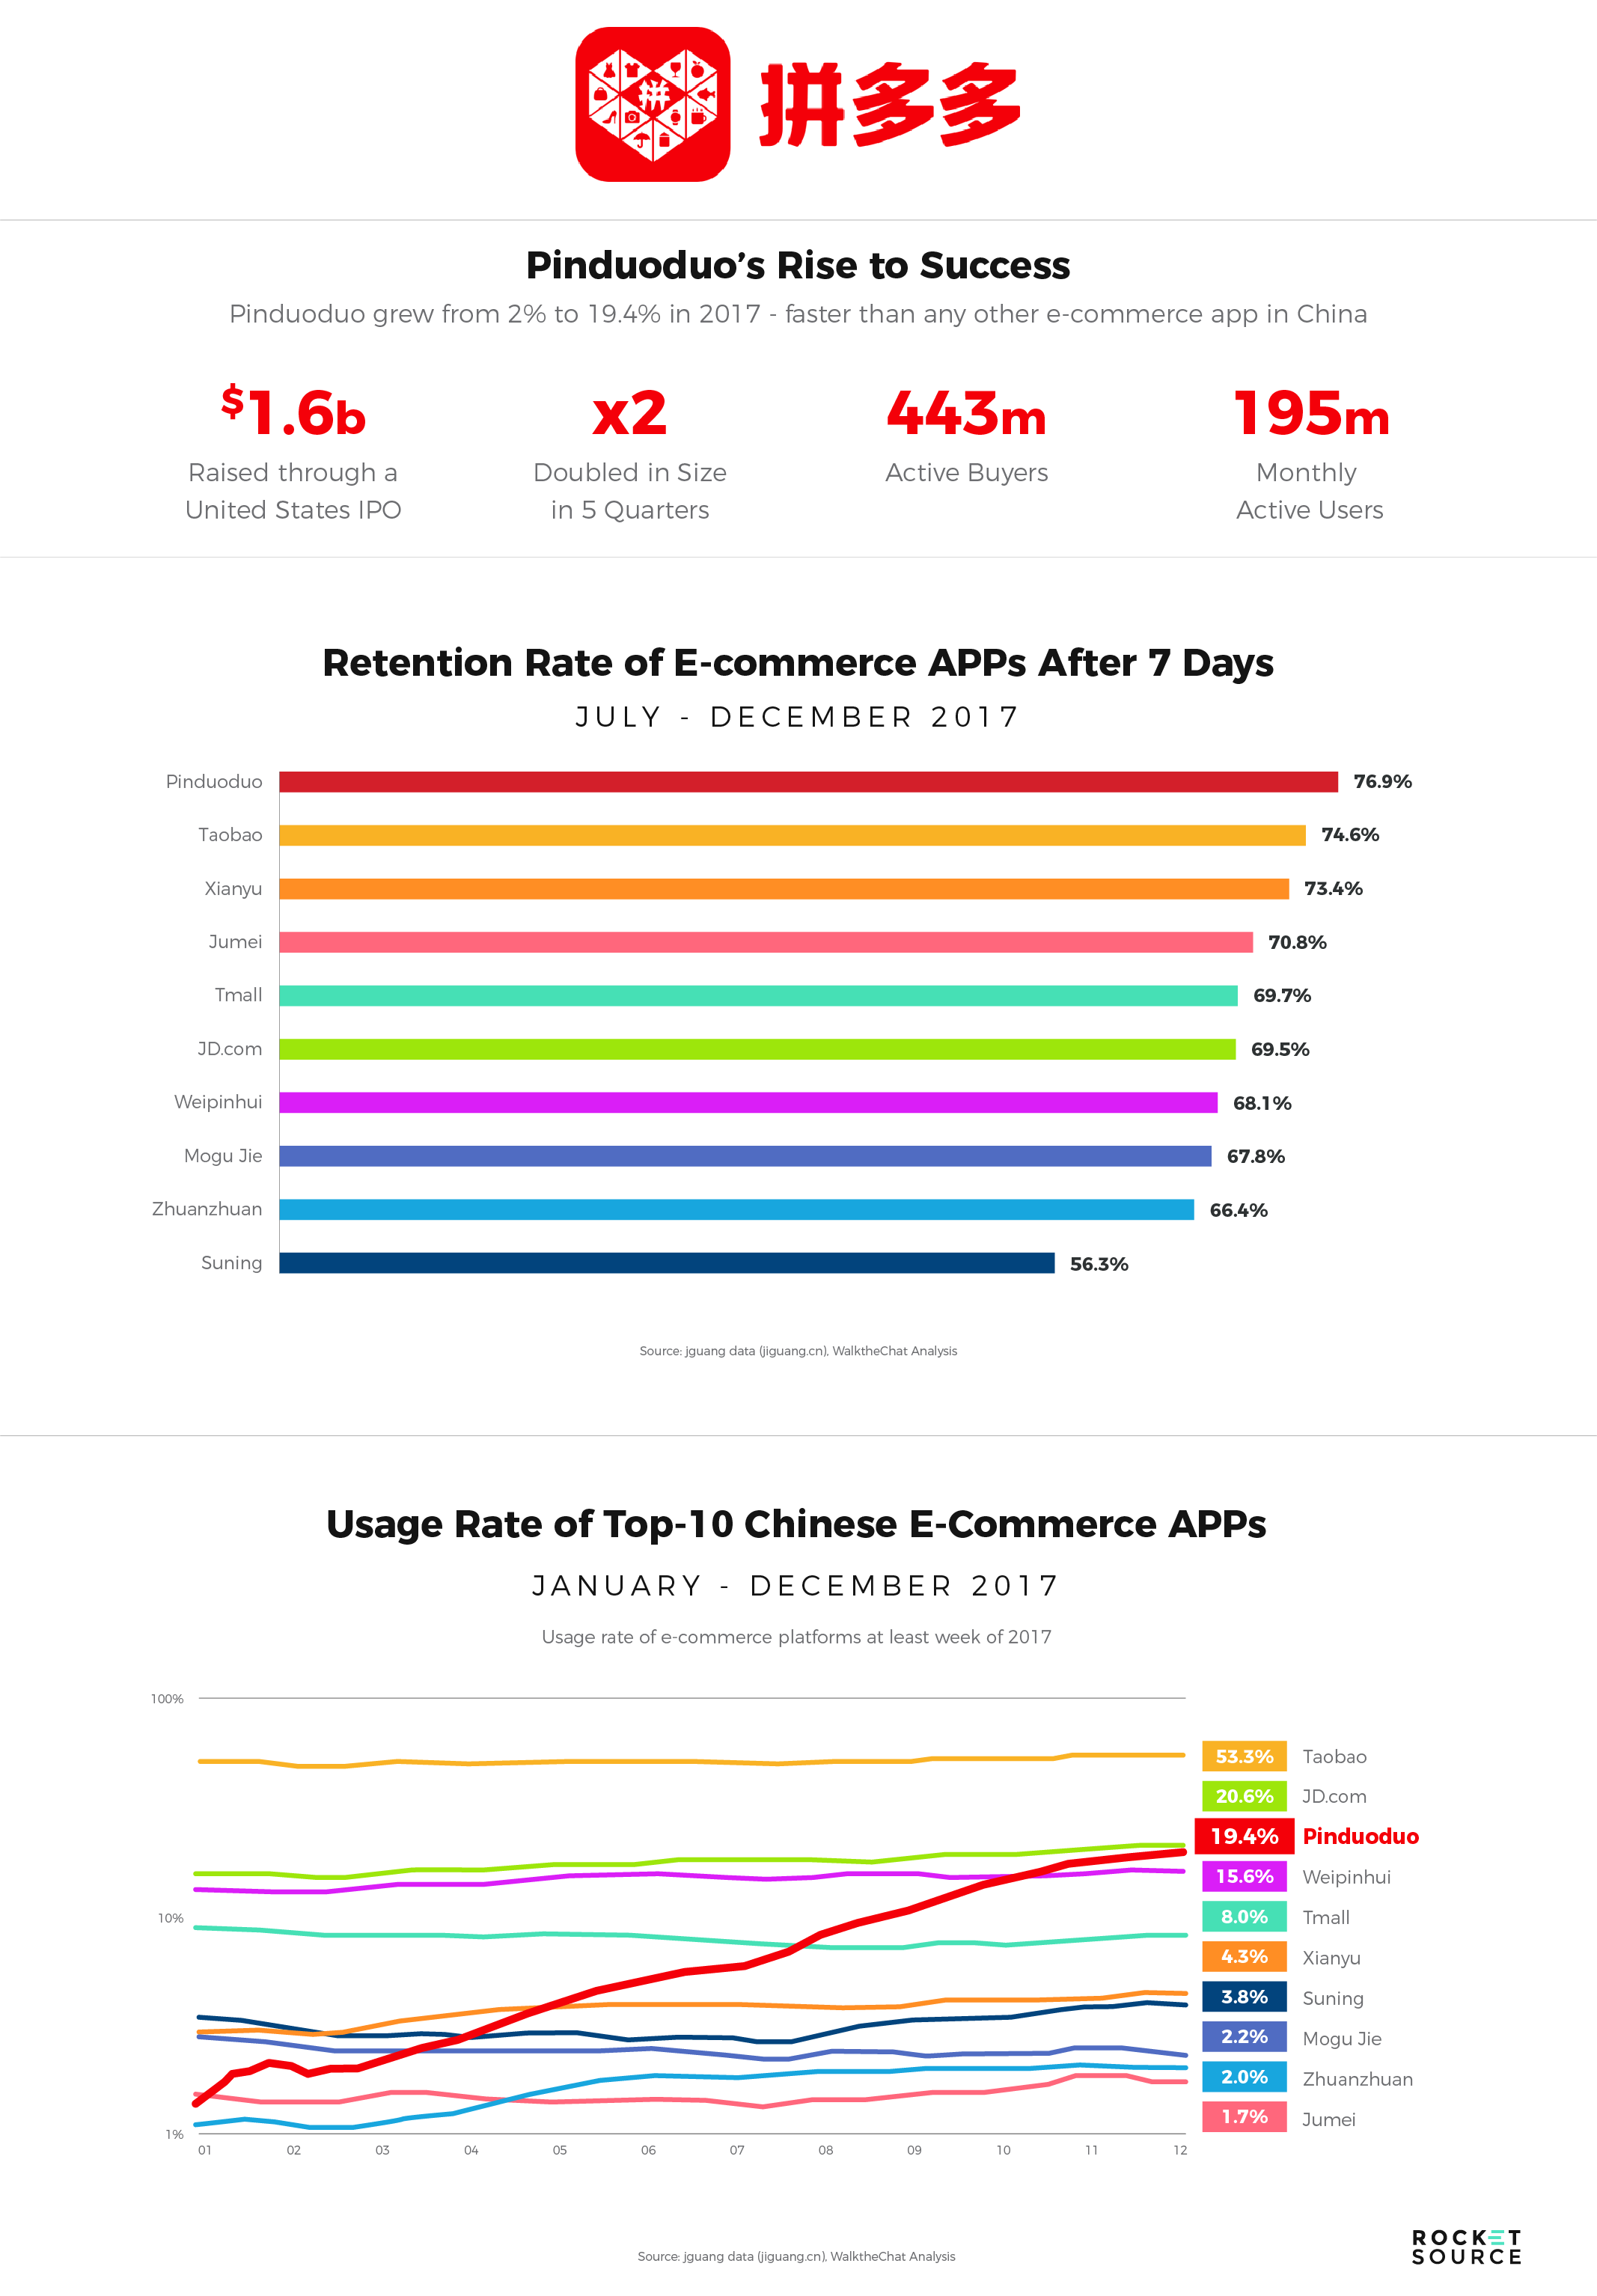
The rise of Pinduoduo has been fast and furious. The company went public after raising $1.6 billion through a United States IPO, which was one of the largest deals made in 2018. In only five quarters the company doubled in size, reaching 443 million active buyers and 195 million Monthly Active Users (MAU) today. That high growth is likely due to their high retention figures. At 76.9%, Pinduoduo boasts the highest retention rate of China’s e-commerce platforms.
Pinduoduo’s success is evidence that understanding a customer’s story and preferences is pivotal to gaining traction in any market. With Pinduoduo, developers took a very different stance, informing manufacturers what to make based on consumer interests rather than stocking products based on guesswork around the latest trends. Through deep intelligence and decision sciences, organizations like Pinduoduo can humanize data and add empathetic depth to the insights being aggregated day in and day out.
As I’ve mentioned in the past, bow tie funnels are a simple way to get an idea across, and they probably worked well early on for Pinduoduo; however, they lack the depth needed to really understand the entire pre- and post- path-to-purchase. And traditional customer journey maps just aren’t cutting it when it comes to driving journey analytics, innovation loops, conversion optimization and retention strategies, agile development cycles and more. This gap is what prompted my team and me to continue developing the Customer Insights Map.
Arriving at this more intelligent customer journey map didn’t happen overnight. It came after a tremendous amount of hard work and a personal crusade to deliver the most sublime experience possible. This crusade started for me years ago.
If Only Customer Journey Mapping Was a Simple Exercise…
Innovating on something as widespread and foundational as the customer journey map is no small feat. Without question, I probably wouldn’t have been able to do it with nearly as much success if not for some fantastic teachers and methodologies. One of those mentors/teachers was Mary Ann Holladay, an unsung master and pioneer of the renowned Hoshin Methodology. She taught this highly-regarded methodology to me and my colleagues at iBahn (formerly STSN) over 15 years ago. Since that time I have deployed it many many times with incredible results.
At the time, innovating on Customer Journey Mapping — let alone employee journey mapping — wasn’t my focus. Instead, I was tasked with growing the user base on something which seems absurdly archaic in the context of today’s world — growing the usage of High-Speed Internet access to hotel guests, business travelers and corporate conferences.
School-aged kids might not believe this, but it wasn’t too long ago that the concept of having Internet access in a hotel room was new — so new and technologically sophisticated, in fact, that we at iBahn were having a hard time executing on the concept. As we continuously ran into significant stalls, we discovered how to put the Hoshin methodology to work to find serious solutions along the customer journey across multiple cohorts. It’s worth noting that this work also helped kickstart my breakthrough approach to empathy mapping, qualitative data looping and ultimately, as evidenced in this post, Customer Journey Mapping.
What the Heck is Hoshin and Why Should You Care?
If you’ve ever worked closely with me, you know I advocate heavily for the Hoshin methodology. It works well at pulling priorities out of teams, planning the best next steps, and keeping everyone on course toward an actionable goal. What I love about it is that it goes leaps and bounds beyond the average brainstorming session. The approach is unique. The Hoshin method is done in utter silence. Yep. Complete silence.
I nearly fell out of my chair when Mary Ann Holladay told us we’d be planning and brainstorming in silence with nothing but an old office favorite — sticky notes; and yet, that’s what we did. Without talking, we hung, moved, and sorted those colorful notes to figure out our next steps. I’m simplifying it here but know this — when in action, the process methodology is powerful and poignant. Here’s why.
Everyone in the room is on a level playing field, as all members are required to take part in curating, sorting, and labeling ideas. Rank doesn’t matter. Neither does the volume, passion, or conviction that people use to get their proposed ideas to rise to the top, thus negating the “loudest voice in the room” problem. Ideas have to stand on merit instead of being judged by the person suggesting them. Everyone participates equally until they reach a unanimous solution for a specific problem.
The first time I experienced Hoshin planning, the empowering feeling of equality of creative and logical reason was refreshing. That balance and silence enabled us to move quickly through the brainstorming session in harmony and with momentum. To give you an idea of what it feels like, take a look at a recent Hoshin exercise we moderated at one of our LevelNext MasterClass Workshops on Modern Business Transformation.
Hoshin Exercise @ LevelNext
We’re not the only ones who teach the potential behind this planning methodology. Hoshin is used in companies like Nissan, Toyota, Hewlett Packard and Bank of America. It’s a process powerful enough to tackle transformative initiatives in big companies, but also versatile enough to be just as useful to our humble team back at iBahn.
If this post was all about how I’ve used and modified the Hoshin methodologies over the years, I’d go into a lot more depth on why I am such an advocate for this exercise. But this post is about Customer Journey Mapping, so let’s get back to how my team at iBahn used Hoshin.
What’s the Role of Hoshin in Customer Journey Mapping?
After going through the Hoshin exercise, my team and I realized that we had to divide and conquer to reach our big goal of growing adoption and usage of our high-speed internet access solution to hotel rooms worldwide. We formed a team, which we lovingly and ironically named the “Sexy Six,” and outlined six US-based geographic boundaries (one for each of us to tackle). That division of geographic territories caused many of us to uproot our families and commit to spending days, weeks, and sometimes even months on the road — and we did so gladly because we were StoryVested. We knew that the intense legwork and sacrifice were mission-critical so, like a high school football team before a rivalry game, we put our hands in the center of the circle and yelled “break” before heading out to gather the qualitative data we needed to achieve our goals.
We actively managed the installation and deployment of our solution, training, adoption, upselling and growth in every hotel. We covered a wide swath of brands (i.e. Marriott, Ritz Carlton, Hilton, Mandarin, etc.) and hospitality staff, including but not limited to, General Managers, Operations, Sales and Marketing, Directors, support staff, front desk managers, concierges, engineering teams, etc.. I can’t tell you how many days and nights I went directly from working in dusty telco closets to quickly dusting myself off to train the staff and General Manager of the hotel. We were all elbow deep in the thick of it, and all we could think about was getting more users to purchase our solution within a partner hotel.
Along with access to segmented data repositories from Marriott International, one of the tools we were given to help us reach our growth goals was customer relationship management (CRM) software tied to an internal custom-built MAC Address network to node access system tied to each room. Both sets of software helped us break out the various stages, such as when and how often a traveler would connect, but it didn’t answer the behavioral “why” — the driver of usage — and the sequence of events leading up to and following that purchase.
After loads of front line research and qualitative/quantitative mapping, our team zeroed in on a Cohort Based Marketing initiative targeting the business traveler cohort (vs. the personal traveler) and the brands most likely to send those cohorts into a fully installed hotel. In retrospect, one driver was obvious: productivity enhancement. Brands wanted their road warriors to be as productive on the road as they were at HQ. With layers of quantitative and qualitative data in hand, I began using colored post-it notes to map out the path-to-purchase journey (and repeat path-to-purchase) of a business traveler attending a conference versus a business traveler using the hotel as a place to stay.
I was so compelled by how the cohort traversed his or her journey that I started down the path of creating my own version of Customer Journey Mapping long before it was a thing. With an expensive MBA in hand, I took all the gorgeous data at my disposal and dropped it into spreadsheets, aggregated and crunched the data, ran confidence levels, and built statistical models to see where I could find predictable patterns (which I will address later on in the post as things will get a bit more technical). The ultimate outcome of this lightweight pattern recognition analysis was the generation of new levers to grow usage. With those ideas, strategies and levers thoroughly outlined, I brought my new journey mapping concepts to my boss and kickstarted the process of brainstorming a new consultative division which would align with Marriott’s consultative arm for the sole purpose of growing usage adoption at a faster clip.
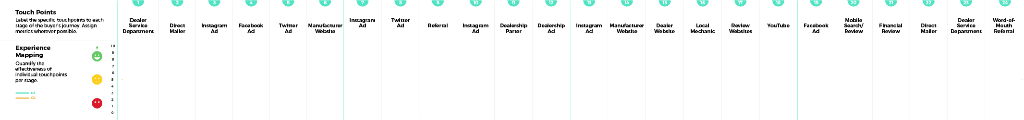
Once again using the Hoshin process I, along with my incredible “sexy” colleagues (truly LOL here) brainstormed what our buyers were doing, how they were finding us, and what triggered them to convert from one stage of the funnel to the next. We mapped out the quantitative and qualitative data we’d collected over the course of thousands of customer interactions. By using tools like sticky notes, spreadsheets, and the Adobe Suite, our mapping iterations evolved over the years. I scoured my ecosystem for an actual picture of the maps we used but couldn’t find any. These images are the closest I’ve found to the maps we originally put together.
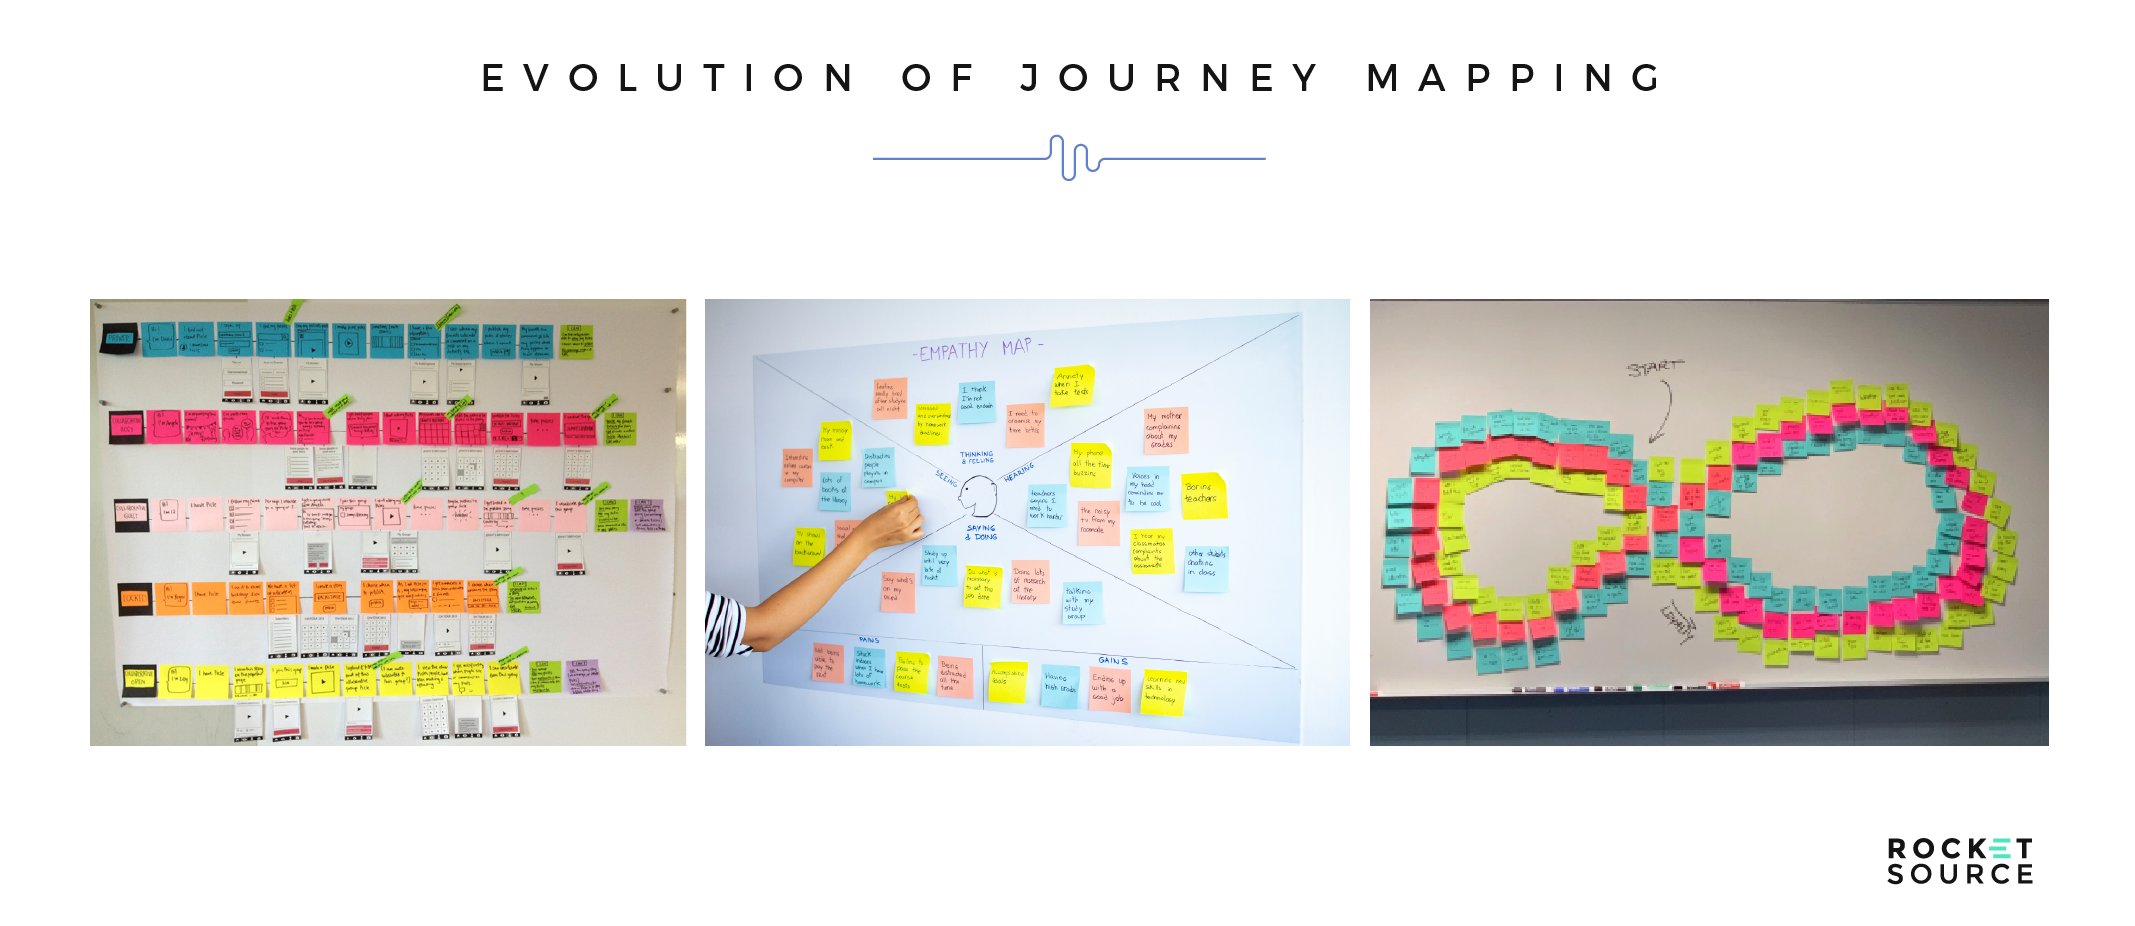
As we iterated on these mapping systems we used various colors of sticky notes to denote each target group of customers. The color distinction was important because it allowed us to track multiple cohorts on one map and/or deviations from the mean. As we continued to iterate on the design, we were able to gain a better understanding of what was happening along the buyer’s journey — but we went deeper than that too. We started looking at employees’ experience at each hotel and how that experience was applied to our product offering. As intuitive as this might sound, it was an uncommon lens through which to view the end customer’s journey. Even today, few organizations look at the buyer’s journey through the eyes of the employees closest to the end-user of the product.
Simplistically, here’s how I approached aligning the employee’s experience with the customer’s experience at iBahn.
To gather the internal feedback, I aligned each cohort and broke it down demographically, psychographically and behaviorally with the employee at the hotel with whom they engaged most often, such as a front desk clerk, concierge, housekeeping, tech support and maintenance and engineering. I’d then talk with those employees to peel back more layers of information about the customer, such as their expectations, failure points, a-ha moments, processes they preferred, educational content needs and more. In doing this, we uncovered ways we could lighten the employees’ load and create a better employee experience (EX), which ultimately resulted in a better customer experience (CX). All of this seems easy to talk about now, but in reality, this stuff was and continues to be very hard.
Building a successful customer journey map requires the heavy lift of excellent data looping. You have to know the right questions to ask and your protocols must be tight. You have to know how to interpret the answers without tainting the data. You have to know how to make decisions, even with limited sampling data, low confidence intervals, or hard to interpret p values.
As an output, building incredible innovation loops requires the heavy lift of sifting through the current state of your 3 Ps — people, processes, and platforms — and build a roadmap to get to the future state, ensuring you have the right people, the right tech, the right creative processes and the right ideas supported by the best data to outcompete your counterparts. Again, easier said than done.
Everything I did — and everything I learned along the way — revolved around how to innovate on shoulder-to-shoulder analysis and use that analysis efficiently to sell it into every level of the hotel’s organization. For every new city, every new hotel, I immediately dove into figuring out the right questions to ask, the best collection methodology to use and the right kind of statistical analysis to create efficiencies of scale. For each of those events, I brought the data back into my modified Hoshin and Customer Journey Mapping exercise. After each and every exercise, I’d refine the strategy and tactical implementation, present it, gain buy-in and operationalize.
Thankfully, that set of processes would soon see us leverage a growth strategy with some of the biggest brands on the planet — Apple, Compaq, HP, Nestle, Microsoft, Boeing, Toyota, Accenture and the list goes on — at their headquarters. Those brands became enamored of our solution, and the detailed cohort and account-based growth strategies we launched certainly contributed to the fast growth of the company.
An estimated $75,000,000 in revenue later, I moved on to my next adventure, even as the company surged past that revenue number.
The Next Stage of Customer Journey Mapping Built for Modern Times
Over time, the map we created evolved from being a simple color-coded post-it note map into something that encompassed what people were thinking, feeling, and doing at each stage of the journey. Through this process, it didn’t take long to realize that buyer personas didn’t add a whole lot of value compared to understanding the psychological and behavioral instances of the cohort. Maps, which were rich with feedback like these, are what provided us with new insights to help us become one of the fastest-growing companies in the history of the Inc. 500.
The process was solid, and brought us a lot of forward momentum. Although it worked well for many years, the customer’s journey, as always, was turned upside down by the introduction of new technologies and competitors. As the technology we sold and integrated was more widely adopted, consumers’ behavior changed. They soon wanted wireless, they wanted it for free, and so on. Today’s consumers are finding what they need on their mobile devices rather than from in-room brochures. Travelers seek recommendations via social media rather than by picking up the phone to call the concierge.
Fast forward to a couple of years ago, when I gathered my partners and our team at RocketSource to update the older version of the journey map to reflect the nuances of the journeys of modern mobile- and digital-first consumers.
It’s Finally Time to Unveil the Customer Insights Map
Until now, I’ve only unveiled our Customer Insights Map to a select few — specifically our clients and those who have paid for and gone through one of our LevelNext MasterClass Workshops on Modern Business Transformation. My brother, Clayton Barlow, a leading Microsoft solution architecture consultant to the CIOs of every major university, was one of those who went through a LevelNext MasterClass. Today he continues to leverage the Customer Insights Map, along with our business transformation framework called StoryVesting and the Hoshin methodology, to drive profound, insightful results and gain widespread corporate adoption. Now it’s your turn to see how an asset like a customer journey map, paired with a sound business framework and strategic process methodologies, can serve as a jumping-off point for an intelligent operation.
There’s a distinct need today for the marriage of irrefutable facts (analytics) and traditional approaches to understanding end users (journey mapping) to better predict consumer behavior. Without analytics infused into a conventional customer journey map, organizations will end up relying on gut reactions to the market, and teams will continue being trapped in silos without working toward fulfilling the vision of the organization. That need for a clear, analytical view of modern consumer behavior is what prompted my team and me to build a new and improved map.This map, 17+ years in the making, is foundational to transformational initiatives. Now, after all this time of only sharing bits and pieces publicly, I feel it’s the right time to raise the curtain and reveal the Customer Insights Map. What you see below is only the left side of the bow tie funnel, the path-to-purchase journey. The same type of map can also be applied to the post-purchase retention and loyalty journey.
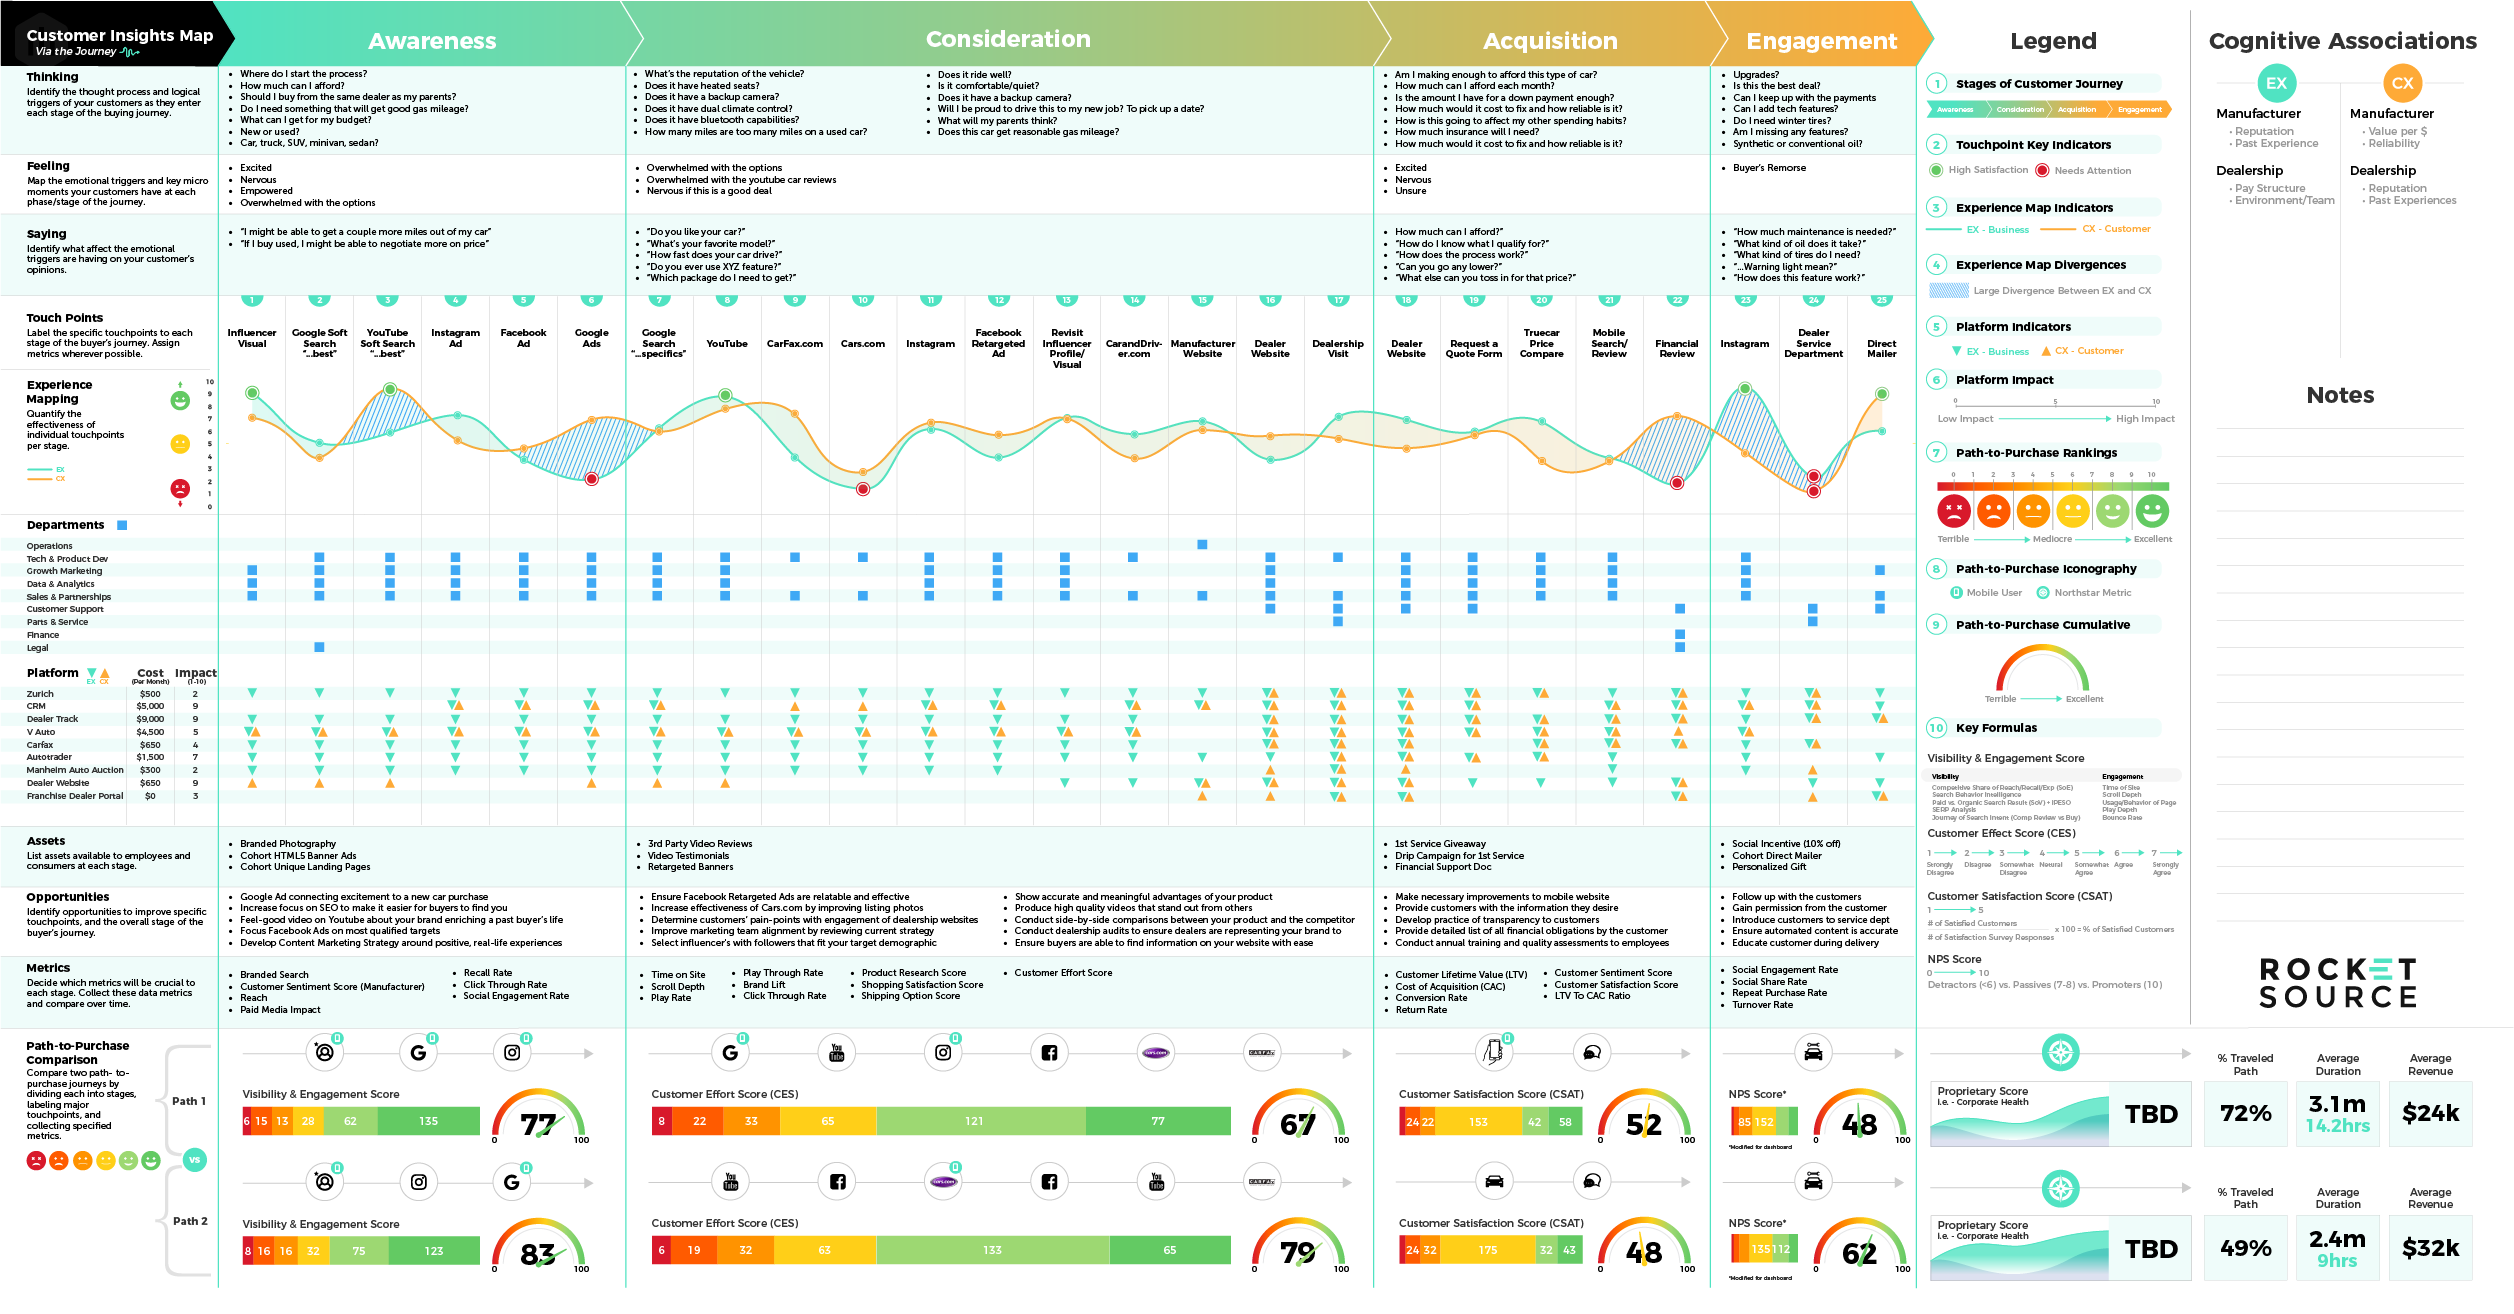
Parts of this map may look and feel familiar, like the journey stages and touchpoints. Other parts might cause you to raise your eyebrows. I caution you against making any snap judgments here. The Customer Insights Map is more nuanced and detailed than any traditional customer journey map I’ve ever seen. Stick with me and I’ll show you why.
We’ve added critical elements to make this map more intelligent, including empathy mapping, the StoryVesting framework, and the Convergence/Divergence bands. Merging qualitative and quantitative data in one place like this offers unprecedented insights for sentiment mining, driving initiatives up the organizational chain, and predicting where to put your money to get the most significant returns.
Before I dive into how to read and use this asset, I want to give a quick disclaimer. If you call into our office, we’ll repeatedly drop the term “Customer Insights Map” on you like a ton of bricks. But, for the sake of this post, we’ll refer to it as the more widely known and familiar nomenclature, “customer journey map.” Don’t let that distract you from the bigger ideas presented.
The first step in understanding how to leverage this map is to get a basic understanding of what’s included. Here are each of the core components and the basic anatomy of the Customer Insights Map:
- Thinking. Identify the logical triggers and define the thought process that goes into the purchase at each stage of the buyer’s journey.
- Feeling. Define the emotional triggers and key micro-moments your customers experience at each stage of the journey.
- Saying. Outline the outward expression of the emotional and logical triggers by clarifying what the customer is likely to say at each stage of their journey.
- Touchpoints. Label each of the specific touchpoints in the buyer’s journey, assigning metrics when possible.
- Experience Mapping. Quantify the effectiveness of individual touchpoints at each stage, monitoring both the customer and employee’s experience along the way.
- Departments. Identify the departments actively involved at each touchpoint.
- Platforms. Analyze the platforms in use or needed, the cost of each platform, and their impact on the overall experience.
- Assets. List assets available to the employees and consumers at each stage.
- Opportunities. Identify opportunities to improve specific stages, touchpoints, or the overall buyer’s journey.
- Metrics. Decide which metrics are most crucial to collect and compare over time specific to the business priorities at each stage of the journey.
- Path-to-Purchase Comparison. Compare two paths-to-purchase by dividing each into stages and comparing key metrics.
- Legend. Use the legend to clarify what’s measured and mapped, reducing the chances of misinterpretation and misunderstanding.
There’s more to this map than just the various categories included. One of the big a-ha moments our LevelNext MasterClass Workshop participants have when we take them through how to leverage this map is how to interpret what’s available. You can look at this map in two ways:
- Horizontally. The most natural way for most of us to read anything is from left to right. When analyzing what your buyer’s journey looks like, it makes sense to look horizontally and follow the same progression your buyer does from the start of their journey to the end. This perspective lets you compare touchpoints and experiences side-by-side and gain a deeper understanding of how purchase decisions unfold or where there are friction points.
- Vertically. As another strength of the Customer Insights Map is the ability to hone in on the details at one specific stage or touchpoint of the journey by looking at the map from top to bottom. Viewing the map through this lens allows you to get a better understanding of what’s happening both internally and externally throughout each stage of the buyer’s journey. For example, if a touchpoint has a lower experience score, you can see which platforms or departments may or may not be contributing to the lower score, and take action in the proper place.
As an intelligent customer journey map, the Customer Insights Map can serve as a type of digital twin, which I cover in more detail below. It can help replicate what’s happening in the minds of the people who are most important to your organization — your customers and your employees. This puts more tools at your disposal to analyze your position in today’s ever-changing market and to predict your next moves.
Still, it only offers half the comprehensive insights needed. Remember the bow tie funnel I showed you earlier? It’s critical that, after the path-to-purchase is complete, your customers continue on a path-to-loyalty by deepening their relationship with your brand. In other words, to accurately understand the experience your buyers want, you also need to understand what happens after they open their wallet.
Looking Beyond Customer Acquisition
Regardless of who you talk to at RocketSource, you’ll hear that the path-to-loyalty is just as crucial as the path-to-purchase. Getting a customer in the door is just the first step. Getting the customer to stick around, tell their friends and family about your business, and buy repeatedly is a whole different ball game. With this in mind, we’ve changed the traditionally limited viewpoint of customer journey maps by extending the Customer Insights Map to look just as carefully at post-purchase behavior as pre-purchase. Here’s what that continuation looks like.
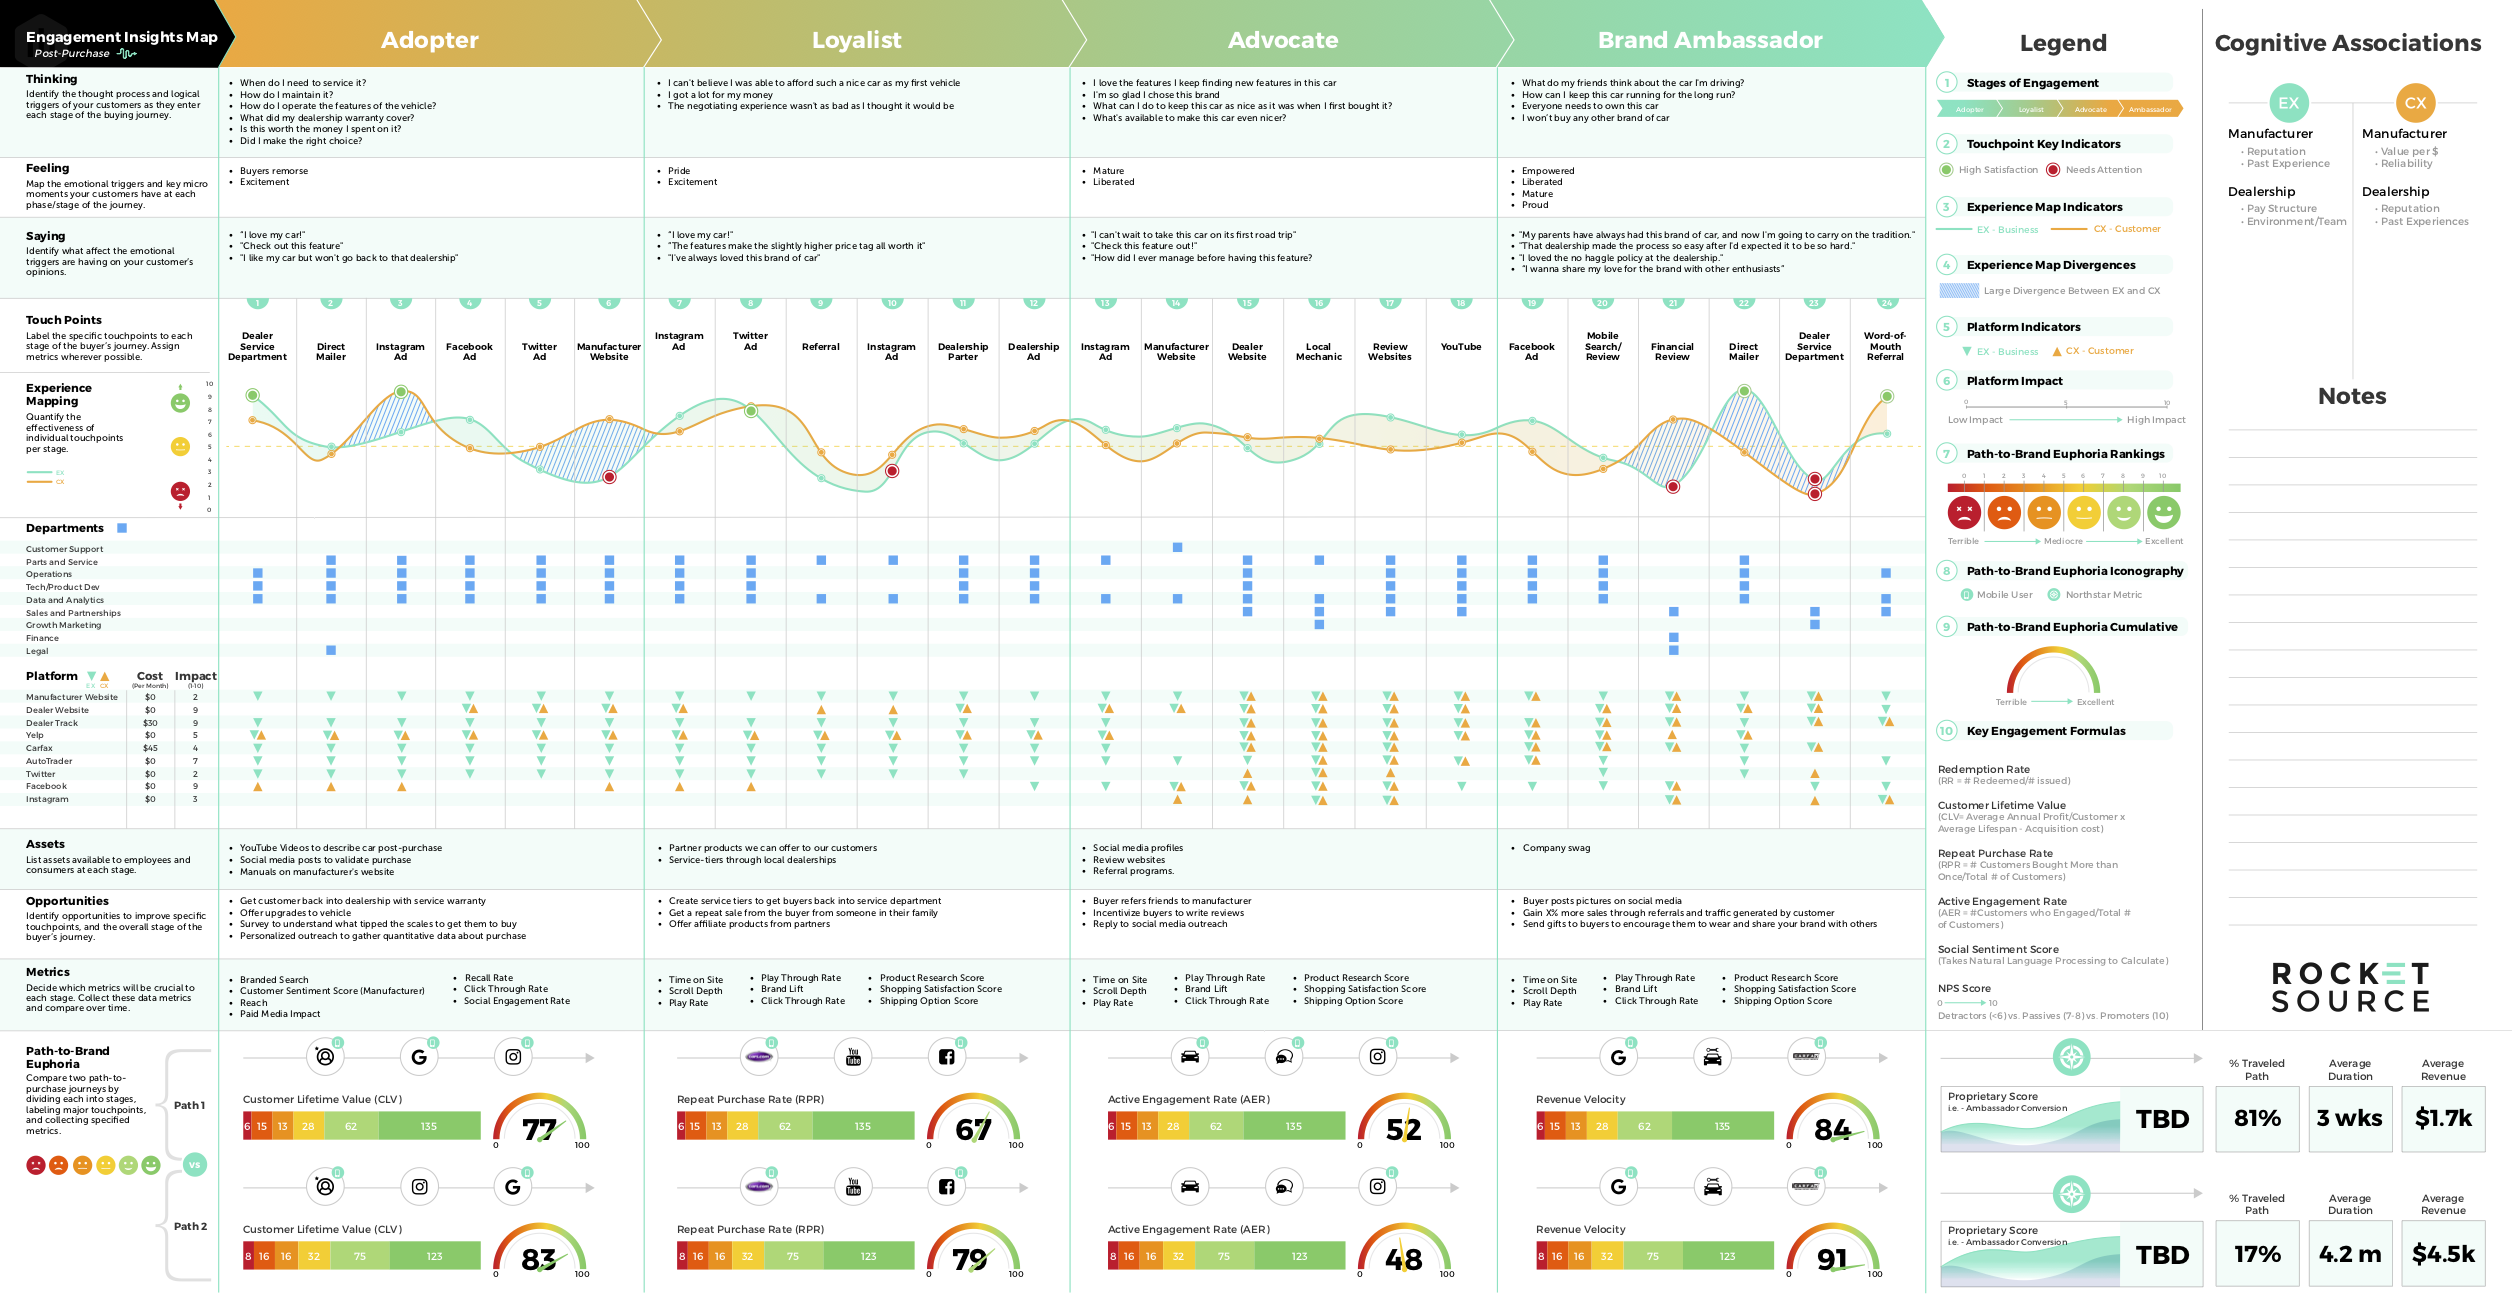
The post-purchase side of the Customer Insights Map is laid out in the same format as pre-purchase, so it can be viewed with full continuity across the entire journey, facilitating an end-to-end perspective (which my team and I often refer to as the “golden thread” of each customer). Still, there are notable differences I want to point out.
- This side of the map focuses on retention rather than acquisition. The insights here show where there are friction points that could lead to the buyer attriting or losing faith in your brand.
- It’s used to understand what’s needed to provide the customer with the best onboarding experience and most support possible throughout their tenure with your company.
- The post-purchase focus is about fostering a deeper relationship rather than building a new one from scratch. The cognitive associations of your brand are more deeply ingrained, making it harder to overcome dissonance and change opinions.
The post-purchase side of the map can be used by all departments to better understand what’s needed to continue meeting or exceeding customer expectations. These are critical insights to know because the post-purchase experience is something the consumer wants brands to improve on, but statistics show there’s still a lot of work to be done. In a CMO Council and Live Technology survey, most respondents (60%) rated their post-purchase experiences with product manufacturers as underwhelming, and 56% said they are generally disappointed with the post-purchase service they receive from retailers or e-commerce websites.
As a business, you can’t rely on a customer to tell you when they have a bad experience post-purchase; you often don’t know until it’s too late. A ThinkJar survey proved just how important customer experience is to lowering attrition rates with this finding:
67% of consumers cite bad experiences as a reason for leaving, but only 1 out of 26 customers will complain.
Without taking a proactive role in gathering feedback and tracking the buyer’s experience, you’ll continue to bleed customers without knowing where there are holes in your product or service offering.
There are a plethora of cases where businesses plug holes in the post-purchase experience and see big results by continuing to nurture customers. Here’s one of the more memorable examples from a company with a strong reputation for stellar customer service — Zappos. This video showcases an actual call received by a Zappos agent and the steps taken to help the customer.
Jewelry | Zappos True Customer Story
This commercial was created after a customer made a frantic call because he packed his wife’s jewelry in a purse and then put that purse into a Zappos box. The woman, not knowing her jewelry was in the purse, took advantage of the company’s 365-day return policy and accidentally sent the purse back. The advertisement shows the great lengths the company took to remedy the situation and emphasized the fact that they’d do the same for any customer. This quality of post-purchase service, along with other post-purchase benefits, was one of the reasons the company snowballed in growth. After only one-decade in business with this customer-centric approach, they were bought by Amazon for a not-so-measly $928 million.
Zappos wasn’t only successful for their level of service post-purchase. They were successful because they were one of the front-runners in digital transformation, embracing technology to deliver a better experience.
Digital Transformation: The Driving Force for a New Digital Experience Map
Think back a few decades. Did you ever spend hours at the local Blockbuster, wandering through aisles of beat-up old DVD and VHS cases? These stores were a big part of many people’s youth — I can still smell the distinct scent of those vinyl cases at the Blockbuster store I frequented during my formative years. Drive around the neighborhood you grew up in today, however, and you’ll quickly see the impact digital transformation has had on this famous brand. While the Blockbuster brand has found a new role in consumer’s lives as “Blockbuster: The Game,” a board game created by Big Potato and designed to spark nostalgia, the actual stores are now shuttered. It’s the closure of stores like Blockbuster which are widening the eyes of forward-thinkers to the reality that digital transformation is necessary to survive in today’s climate.
Current business approaches don’t honor that survival mentality. According to Masergy and Webtorials’ 2019 Digital Transformation Market Trends Report, a whopping 78% of companies agree that if their industry is changing, digital transformation is needed for survival. Yeah, digital transformation is that serious, and yet the data shows that organizations aren’t taking it seriously enough.
39% of organizations say they’re just trying to see a quick return on their digital transformation investments. Only 61% of organizations approach these new initiatives with a mindset of long-term value.
Business transformation, particularly digital transformation, isn’t a one-off initiative to be tackled on a whim. Everything involved in growing or disrupting an industry is intertwined and depends on how well you understand your buyer’s and employee’s needs across their journey — this is much like what we did at iBahn with the Sexy Six. At that time, though, it was only my team and I gathering a limited amount of data needed to understand the buyer’s journey better. Companies today are fortunate to have more at their disposal, such as free Product-Market Fit surveys or tools that make it crazy easy to get inside the mind of consumers. Yet they often still look through a narrow lens.
Organizations often diminish the big picture story available to them by only looking at what’s happening at each touchpoint, but analyzing behaviors at various touchpoints does not tell the full story. The data available for deep analytics at these individual junctures leaves much to be desired due to the lack of a holistic view, inadequate collection mechanisms, disparate repositories, or limited skillsets for mining and modeling. To gain an end-to-end view requires customer interconnected journey analytics across multiple interactions with a brand. Without this breadth (and depth) of insight, it’s substantially harder to compete by meeting the modern consumer exactly where they want to be met — in a perpetual, agile fashion and in real-time.
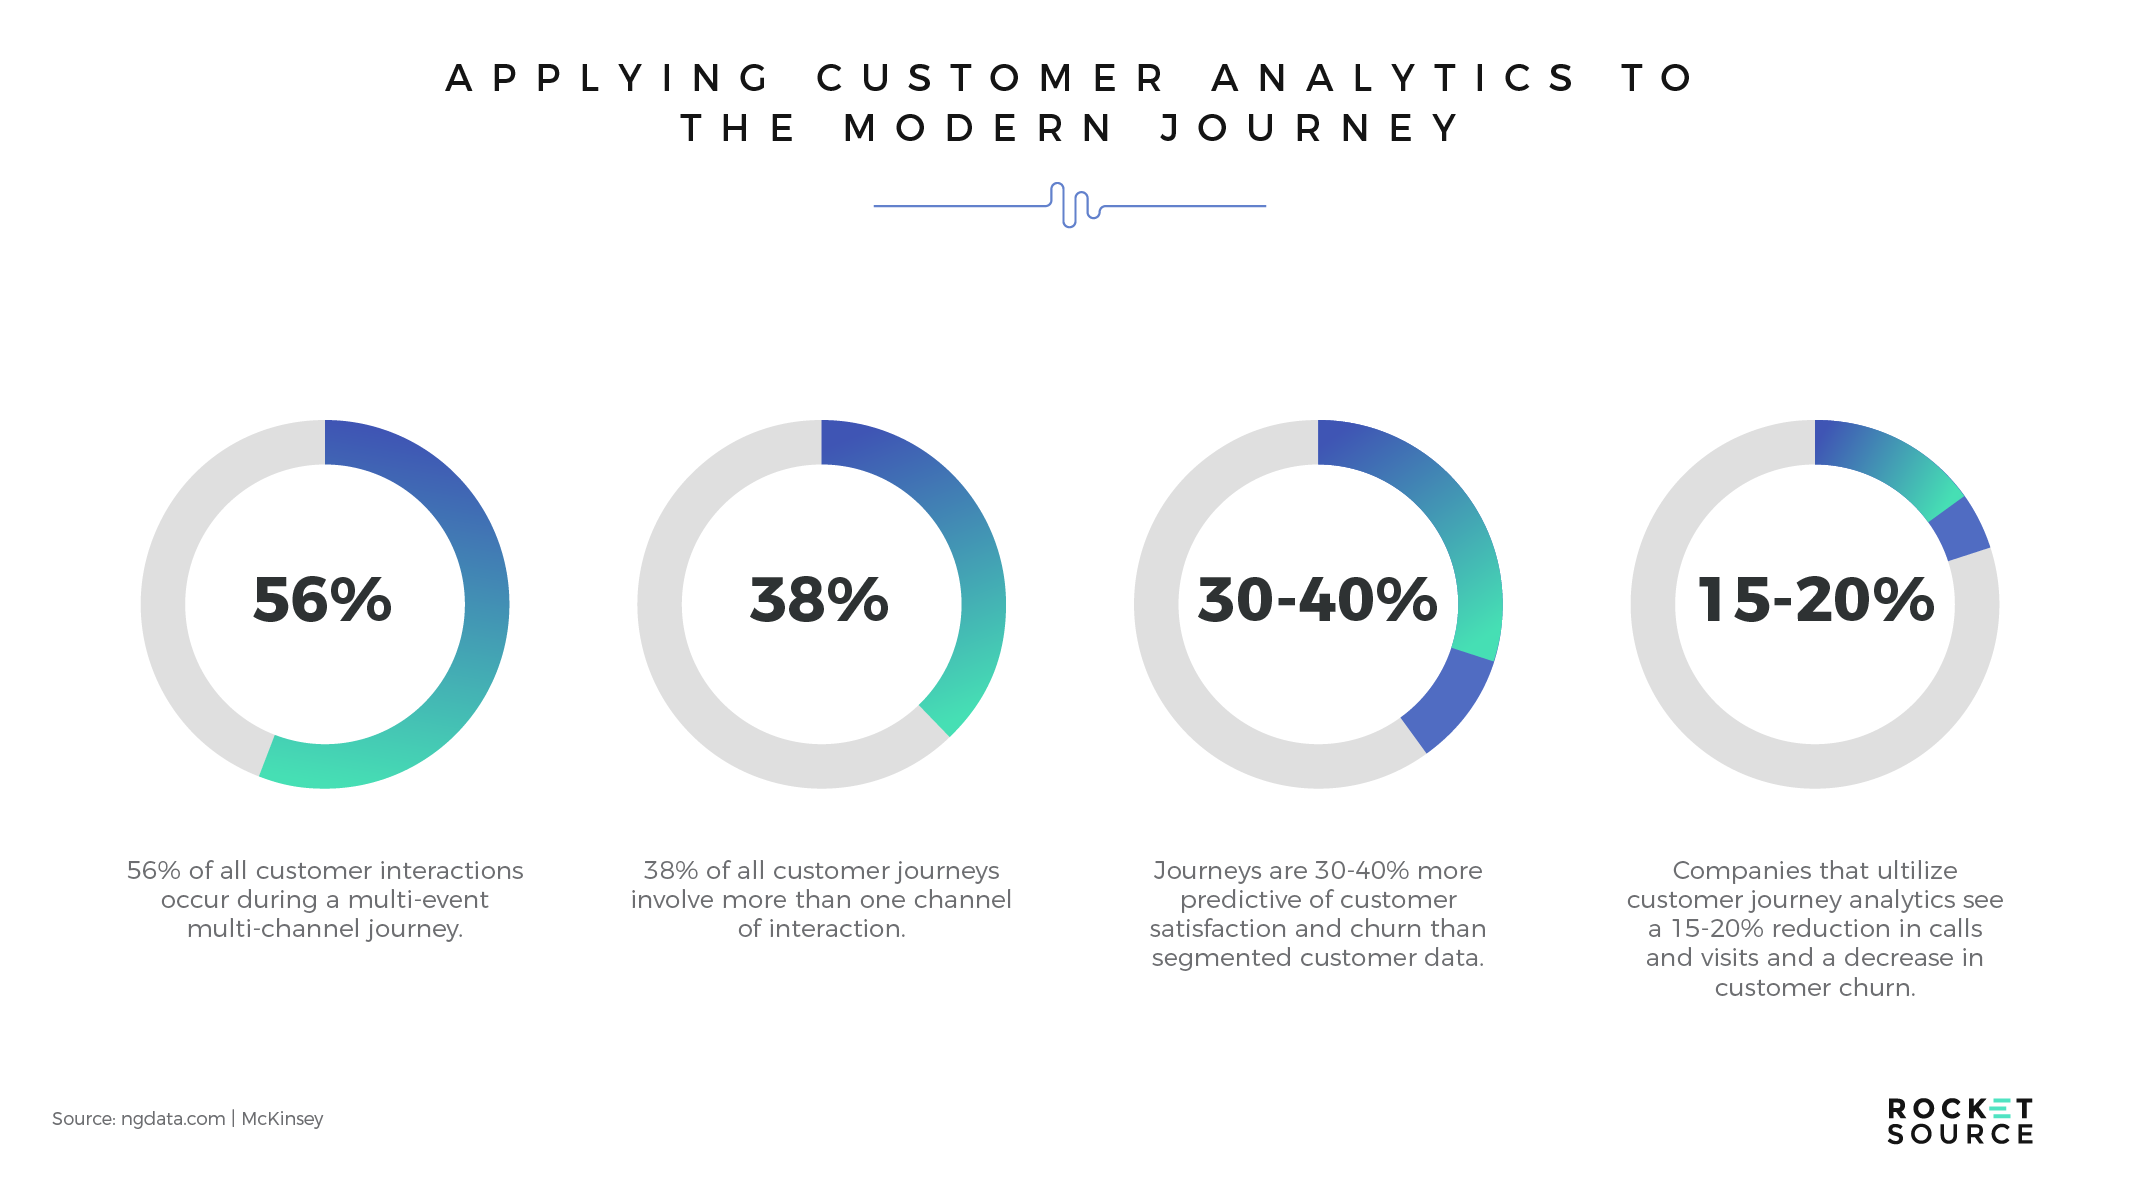
As you can see from these statistics, journeys are multi-event, multi-channel, and multi-faceted. In an ecosystem where more companies are starting to engage in digital transformation, leveraging customer journey analytics to better understand the entire journey rather than just touchpoints is non-negotiable. Differentiating factors, including the convergence of combinatory systems, personnel, sophisticated technology, and intelligent operations and processes, allow for information to be organically disseminated in a democratized fashion across an organization. It’s this pervasive dissemination that catalyzes innovation in the right areas, at the right time, with the right consumers, to deliver sublime experiences where they matter most. The insights gleaned from these analytics offer clear wins for the organization, including a reduction in customer attrition and an increase in customer satisfaction. By analyzing a variety of paths-to-purchase, as I did at iBahn, companies can gain a better understanding of which initiatives to undertake. In other words, it’s less about the guesswork and more about intelligent decision-making.
As an organization, knowing where to show up requires you have deeper insights into what people — customers and employees — want from your organization. That’s where proper journey mapping becomes invaluable.
Exceptional Digital Experience Initiatives Start Internally
When you think of a customer journey map, it’s only natural to think about customers. However, before you can serve those customers, you need to help the people tasked with delivering a best-in-class experience — your team. As you’ll hear in the flight safety briefing before every flight, you have to put on your own oxygen mask first before helping others.
In today’s era, where digital transformation is a necessity for survival, you need people who can look at things pragmatically, analytically, and empathetically. That’s no easy feat, but it’s through this trifocal lens that your employees are better able to spot problems and weaknesses. Giving employees tasked with growth (i.e., everyone in your organization) an experience they’ll embrace with enthusiasm starts by driving engagement. Believe it or not, an intelligent customer journey map can help you reach that goal.
Building Highly Engaged and Efficient Teams Requires Empathy
I regularly espouse empathy within our team as it’s the core of our offering. It’s powerfully simple. Without genuine empathy built into your internal culture, the needs of individuals are increasingly blurred and minimized across the day-to-day operations, politics and sometimes futile tasks of the typical organization. As an empathetic stance becomes diluted, employees become disengaged. When it comes to today’s competitive landscape across digital transformation, disengagement isn’t an option, especially when you consider that companies with engaged employees outperform those without an engaged workforce by up to 202%, according to research by Dale Carnegie.
So what’s the secret to driving engagement as a means of increasing your competitive edge? Empathy is a start, but it’s your empathetic reaction — the outward expression of your empathy — to your employee’s needs that matters more. According to research by Robert Half, that response often comes in the form of professional development. Half’s research found that businesses with a strong learning culture saw as much as 50% higher engagement and retention rates than organizations which did not value continual professional development.
Lack of professional development doesn’t stem from a lack of interest by the workforce. Capgemini found that more employees are investing their resources to remain competitive, and over half of all employees will leave an organization if they feel their skills aren’t being further developed. LinkedIn found further proof that developing your employees is the key to retention with this statistic:
93% of employees say they would stay at a company longer if it invested in their careers.
LinkedIn isn’t alone in their findings. Guthrie-Jenson Consultants’ research on employee training shows that 87% of millennials claim that professional development and career growth are very important. 68% of workers surveyed believe that corporate training and development is the most important company policy.
When we intentionally focus on improving the employee experience via continued learning, many other items fall into place. 76% of employees actively look for career growth opportunities and report higher satisfaction numbers as they are exposed to more corporate training. A culture of ongoing learning is mutually beneficial. The drive to continuously improve skillsets works out well for any organization seeking to undergo digital transformation by giving their employees the knowledge and skillsets necessary to execute on big initiatives. The more they learn, the more engaged your employees will become. An organization which actively works to narrow the skills gap is developing a more talented workforce in the process. As cliche as it might sound, I call that a win-win.
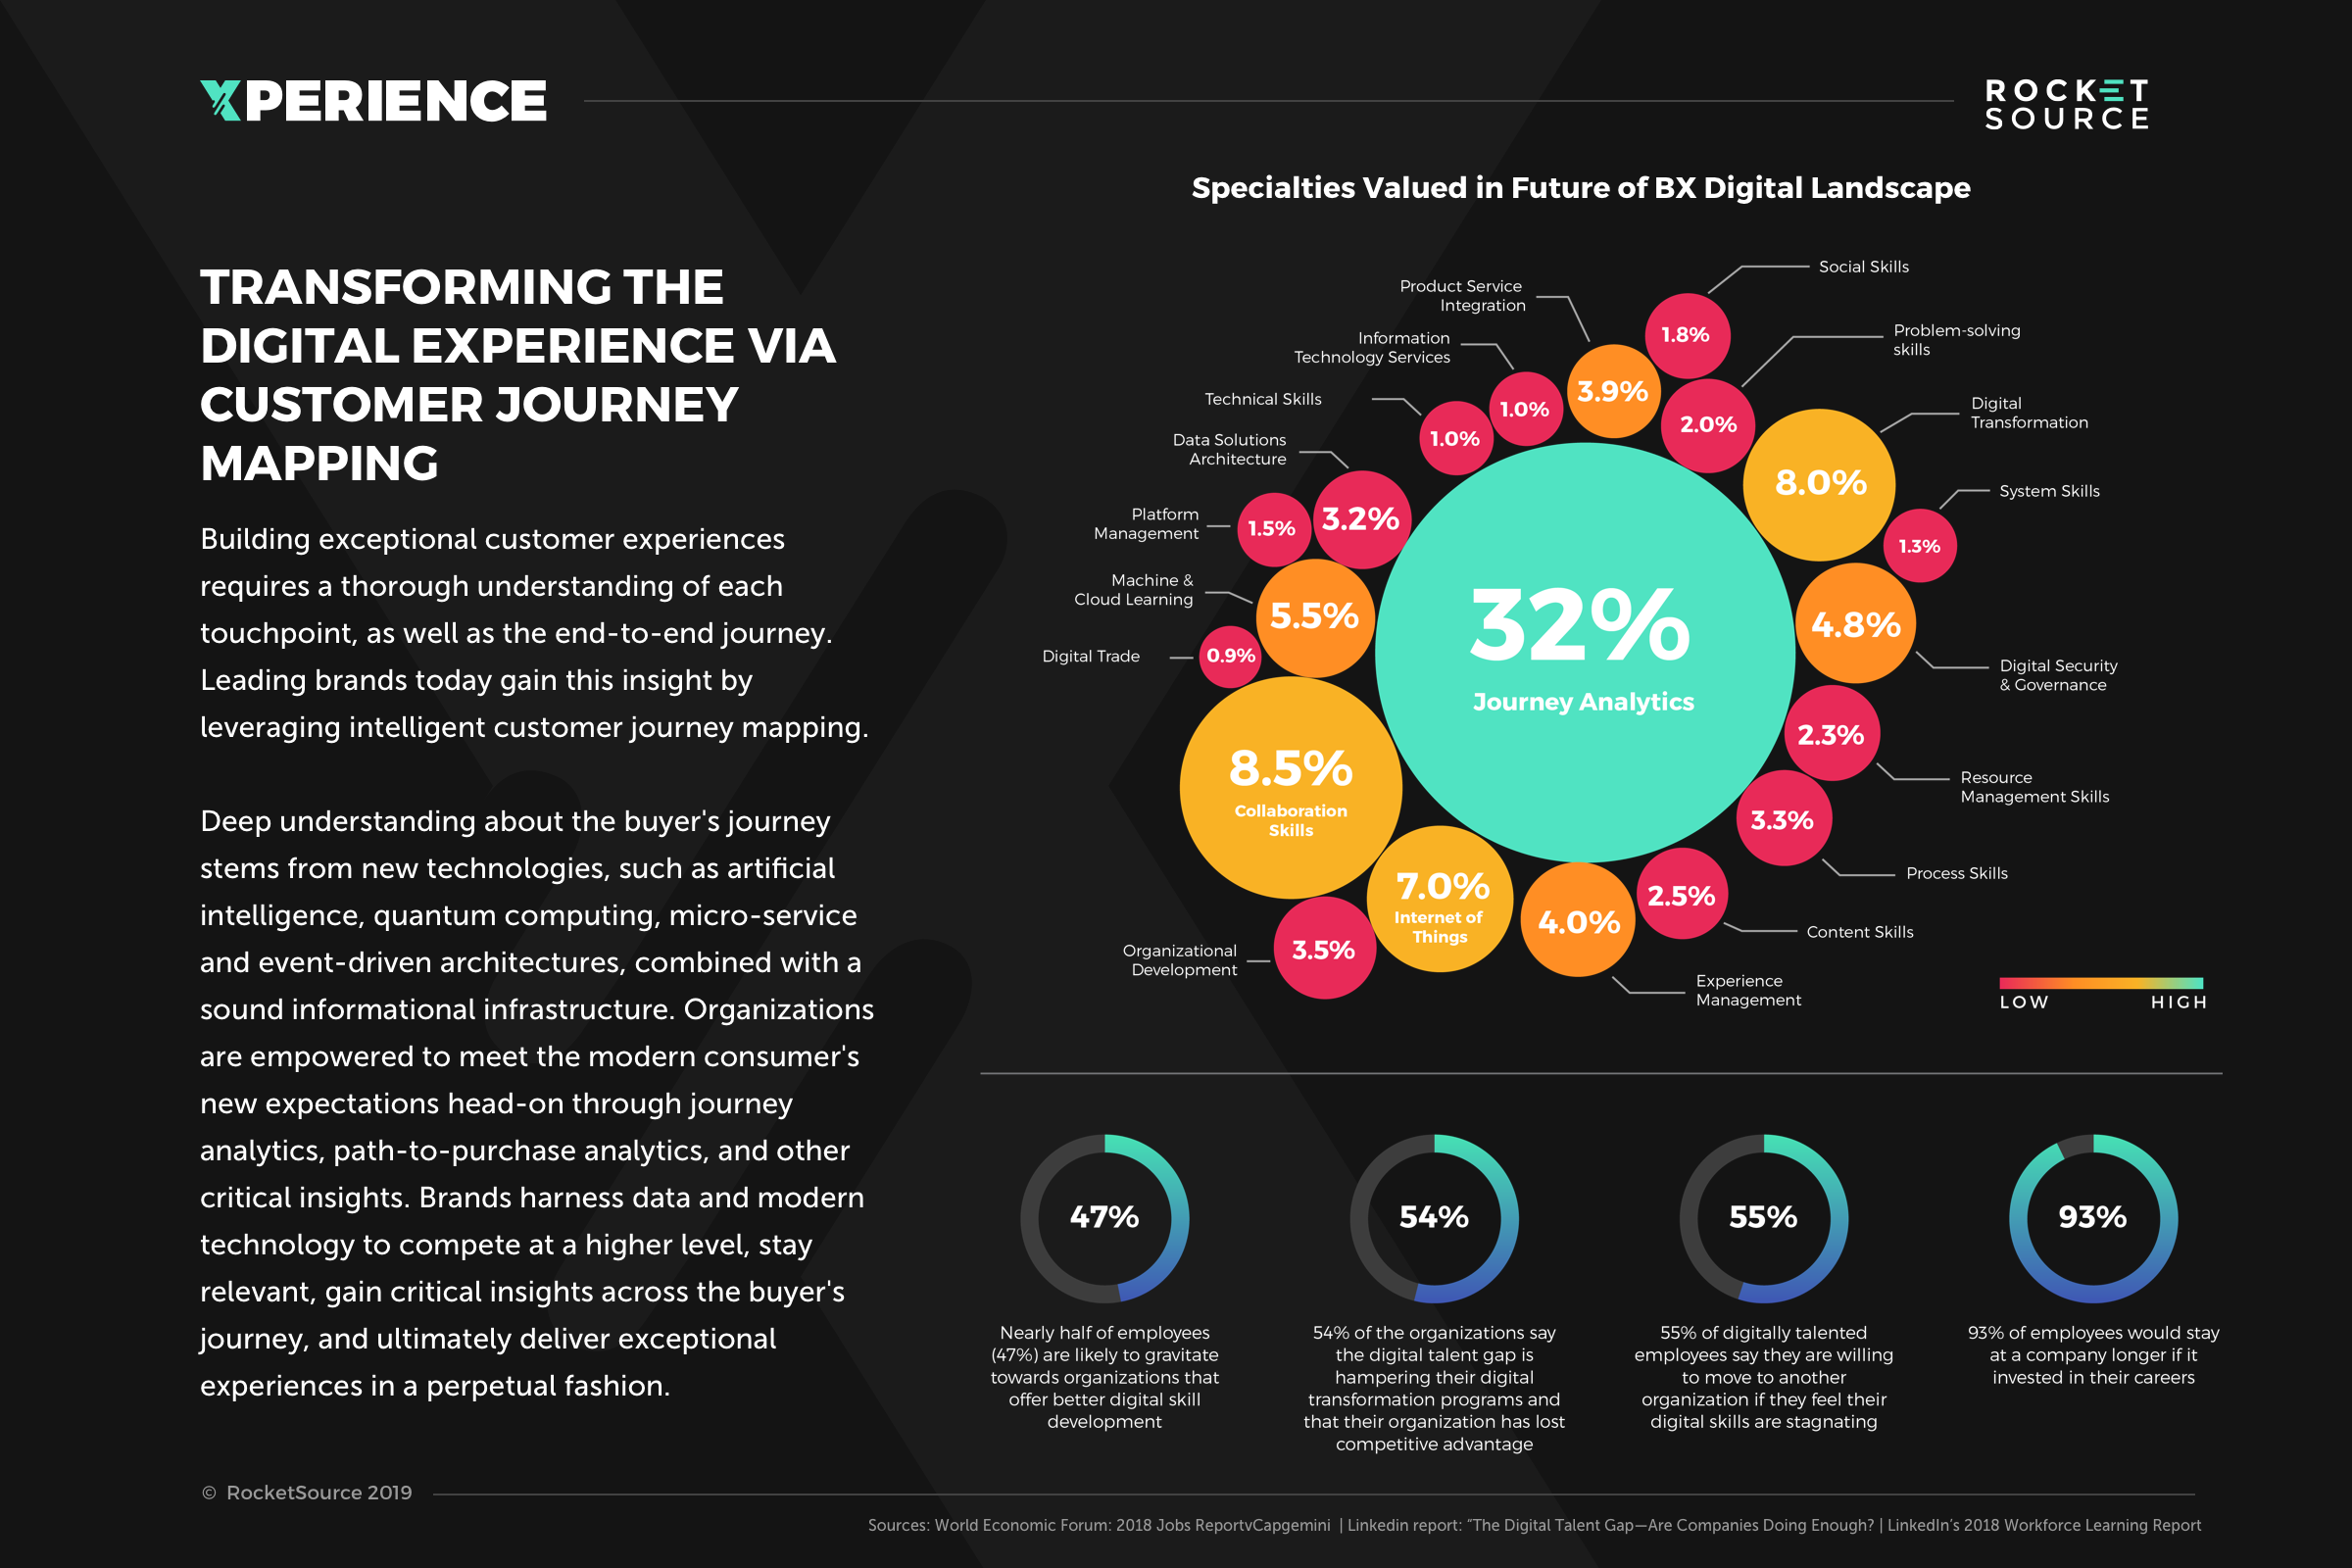
The skills gap is a big deal. In numerous conversations with executives about digital transformation, I’ve repeatedly heard forward-thinking professionals express a desire for essential talent over the coming decades, particularly skilled in understanding and breaking down Journey Analytics across the Brand Experience (BX). The BX covers both the Employee (EX) and Customer (CX) experiences.
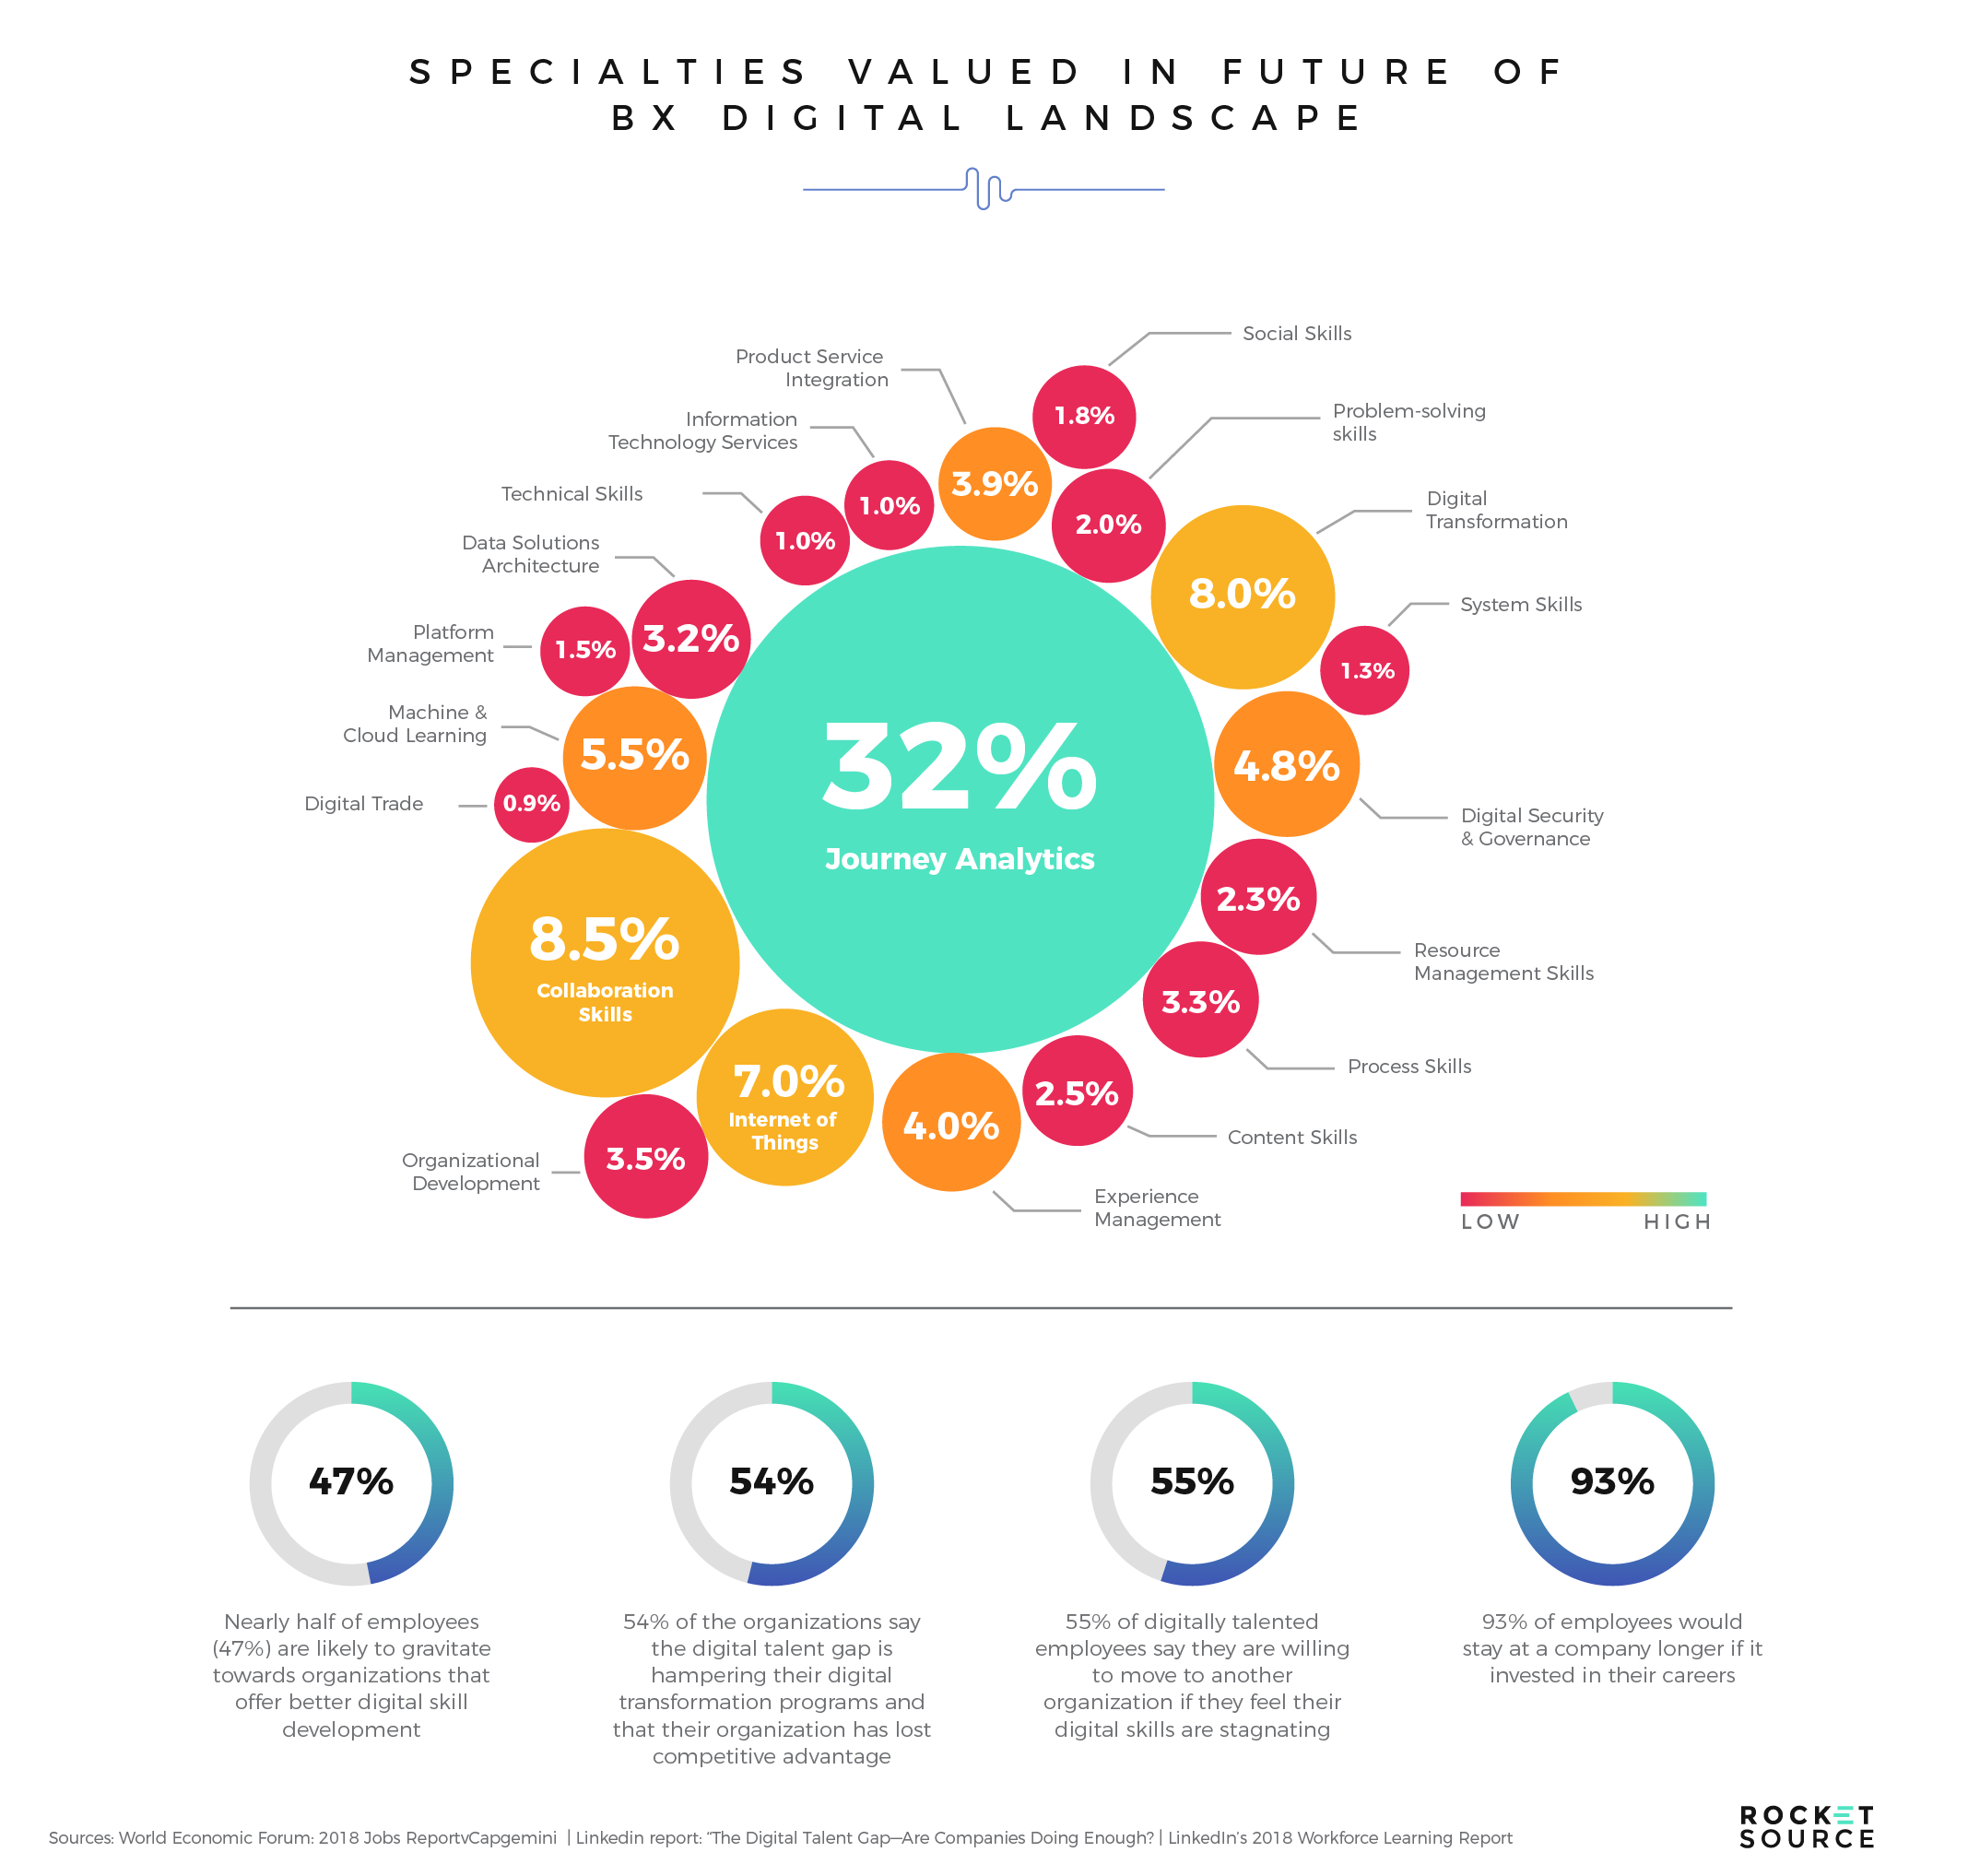
According to our research, journey analytics (which also includes verbiage related to “funnels”) tops that list, with 65% of companies valuing this particular area of expertise. Still, journey analytics, along with many of the other sought-after talents on this list, requires advanced training. Yet, with 54% of organizations surveyed by Gartner saying the talent gap is hampering their digital transformation and ability to retain an engaged workforce and 70% of companies saying they lack employees with the skills needed for both their current role and future career it begs the question — why are companies not investing in employee training?
The American Society for Training and Development found that companies offering comprehensive training see impressive results, yet only 16% of companies are deploying a strategy to skill up current employees or attract new talent. Here are just a few of the perks that a small percentage of companies investing in their employees have seen:
- 218% higher income per employee
- 24% higher profit margin than those who spend less
- 6% higher shareholder return if the training expenditure per employee increases by $680
Organizations which are not investing in employee development see losses which equate to a staggering $13.5 Million per year and 1,000 employees. So, again, why aren’t businesses prioritizing professional growth to fuel the requisite digital transformation? The response we hear from the organizations we talk to at RocketSource is that the company is already focused outwardly on customer experience initiatives and therefore cannot prioritize internal continual learning efforts. That, in my opinion, is a big mistake, especially when you consider the importance of having these skills on board to undergo digital transformation. That’s important, considering that digital transformation serves as the foundation for all other transformative initiatives.
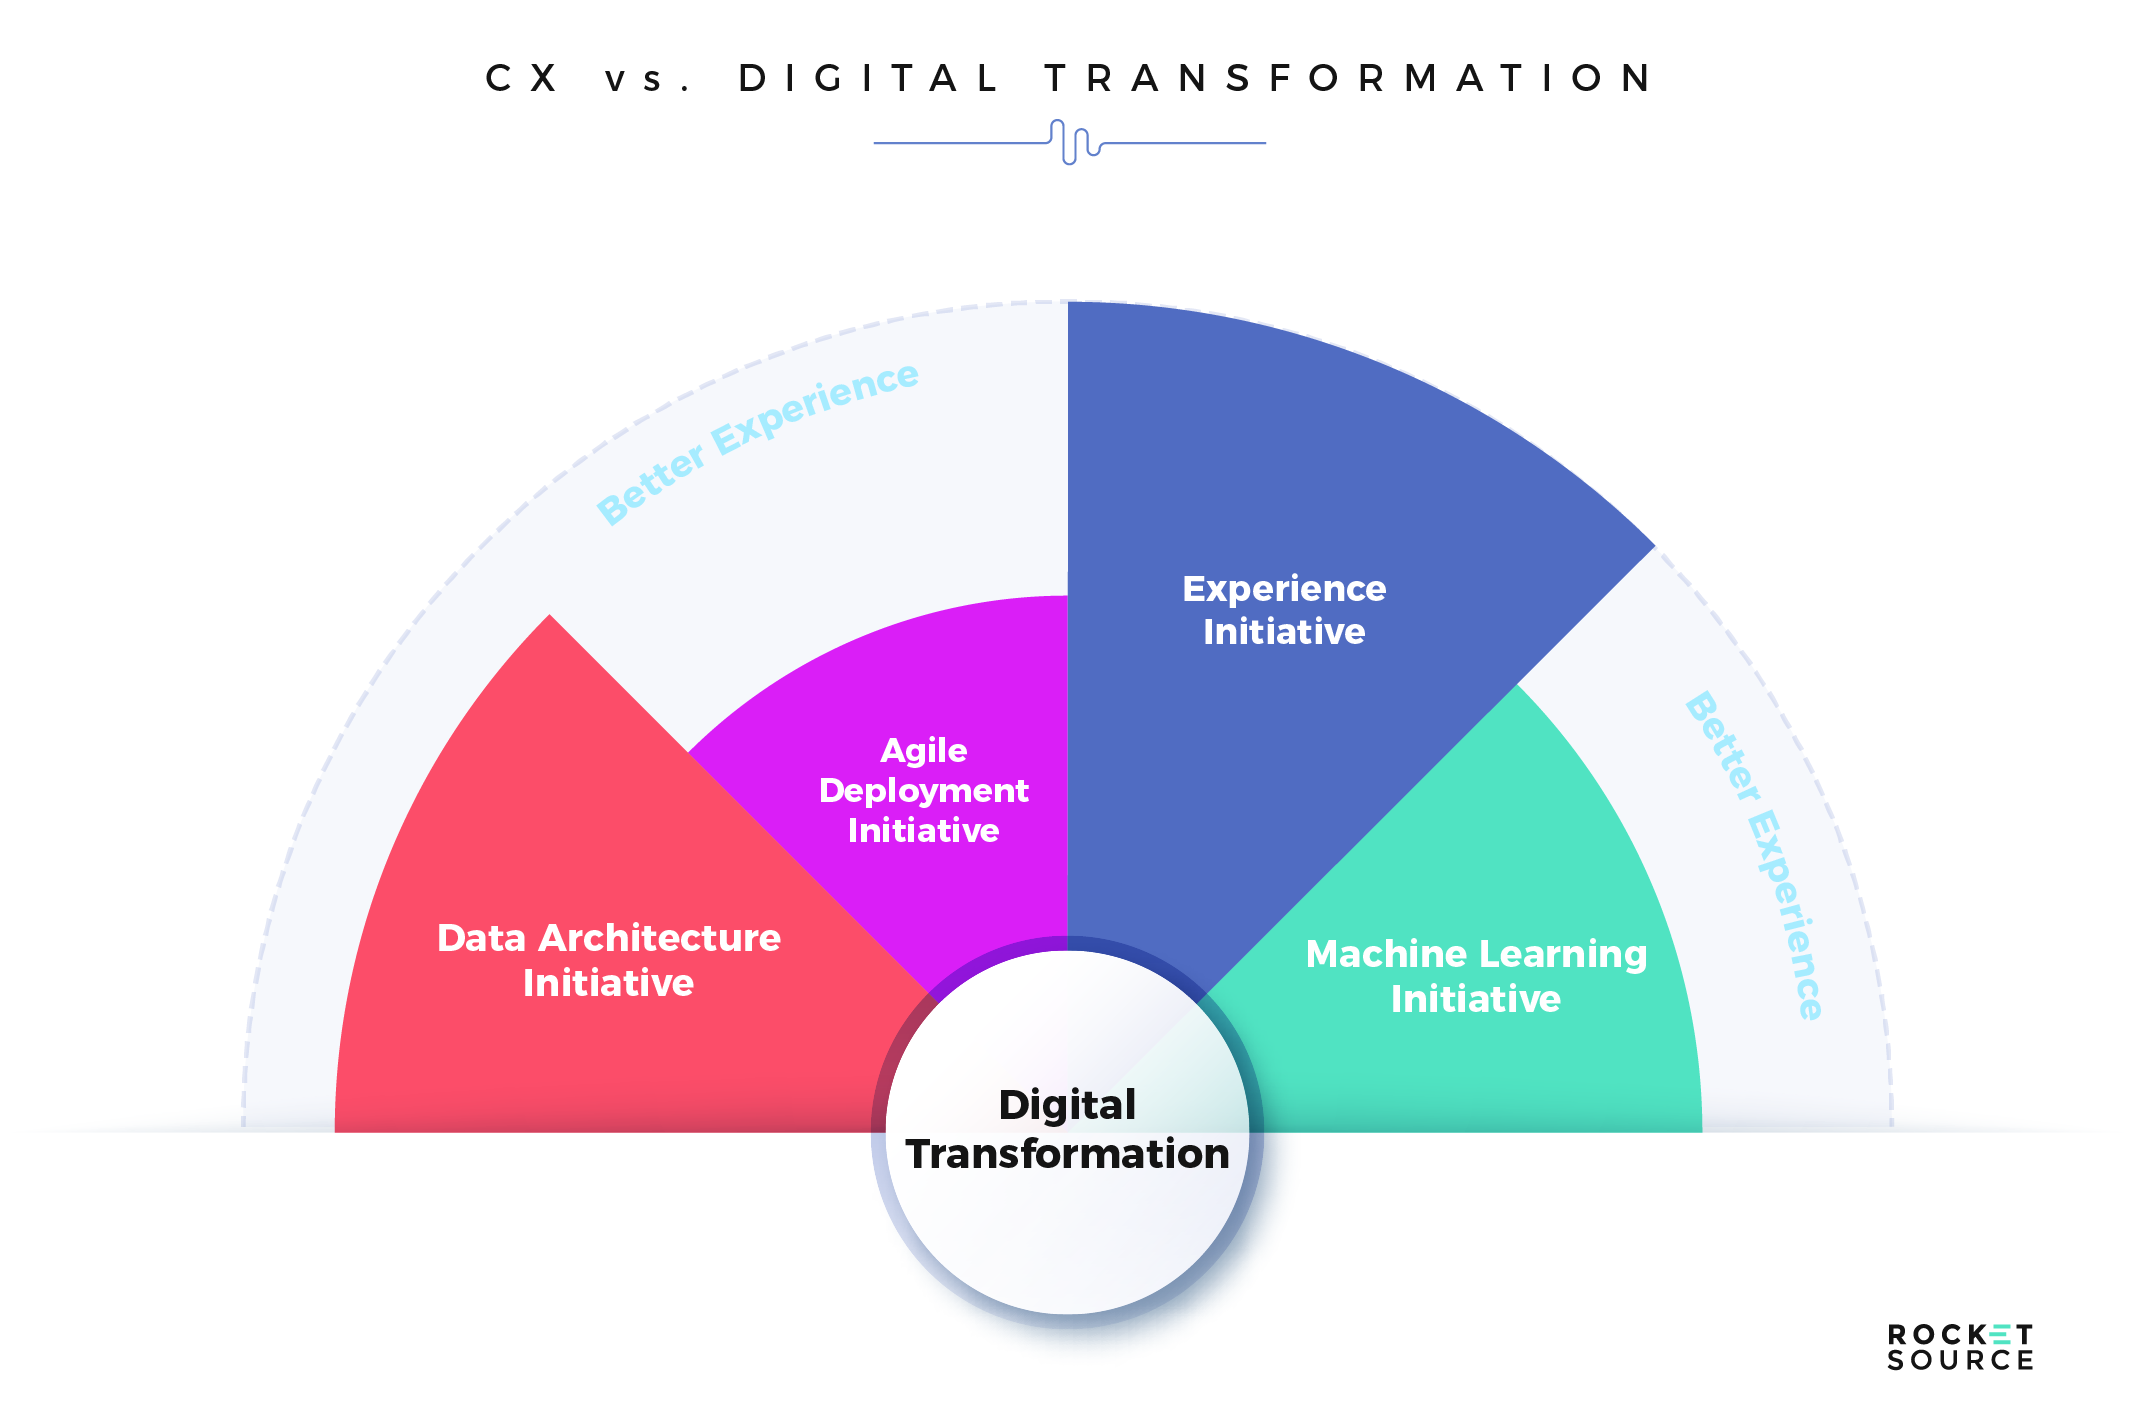
Digital transformation involves adjusting how we leverage technology as a means of delivering something meaningful and valuable to the market. The desire to enhance the output of the organization is the catalyst for any employee experience, customer experience, or other transformative initiatives which drive growth. Without undergoing digital transformation, you won’t have at your disposal the people, platforms, or processes necessary to embrace the top initiatives for your organization’s growth. Without investing in your employees’ professional growth, you’ll struggle to have the right people on board who know how to embrace the platforms and processes necessary to transform alongside today’s buyer.
When you can gain a unique insight into what’s happening along the buyer’s and your employee’s journeys, you’re better positioned to know where you need to focus your transformation efforts. In my experience, one of the best ways to visualize your employees’ and customers’ journeys on a customer journey map is with what I call Convergence/Divergence bands.
Convergence and Divergence in the Employee Experience
Back when I worked on Wall Street, I used Bollinger Bands to predict what would happen in the market. If you’re not familiar with them, these bands help investors make more intelligent decisions about where to put their money. I used them quite often in those days, so when I moved to the world of entrepreneurship and consulting, it only made sense to bring those bands along with me but in a slightly different format. I’ve described how I use these specifically with our Data as a Service offering, so I won’t go into detail on the backstory again here. For the sake of the customer journey map, I use these bands to better understand and predict what’s happening in the employee’s experience as it compares to the customer’s experience. In doing so, what I’ve found is that, even when it doesn’t look like anything is wrong on the surface, you can uncover powerful insights and get out ahead of massive problems just by actively analyzing what’s happening among your team members.
Improving an experience requires feedback to know where things are going wrong, but building those feedback loops takes work — so much so that many organizations avoid it. This point is especially true when it comes to what’s happening internally. Some leaders think if the employee experience isn’t so broken that the employees are voicing a concern or regularly jumping ship, there’s no need to improve it. Others take a head-in-the-sand approach, assuming if they’re doing okay with minimal amounts of effort, it’s enough to get by. The opposite is true. Savvy companies take a more transformative mindset by mapping out internal data to better understand what their employees need before things go south.
One type of internal data crucial to measure is empathy. The challenge is that empathy is typically qualitative in nature, which makes measurement difficult. One way we’ve worked to overcome this hurdle is by quantifying the qualitative data. Instead of keeping empathy-related data high-level and difficult to digest, we’ve developed a way to back up internal data into a radar graph. When done, it looks a little something like this.
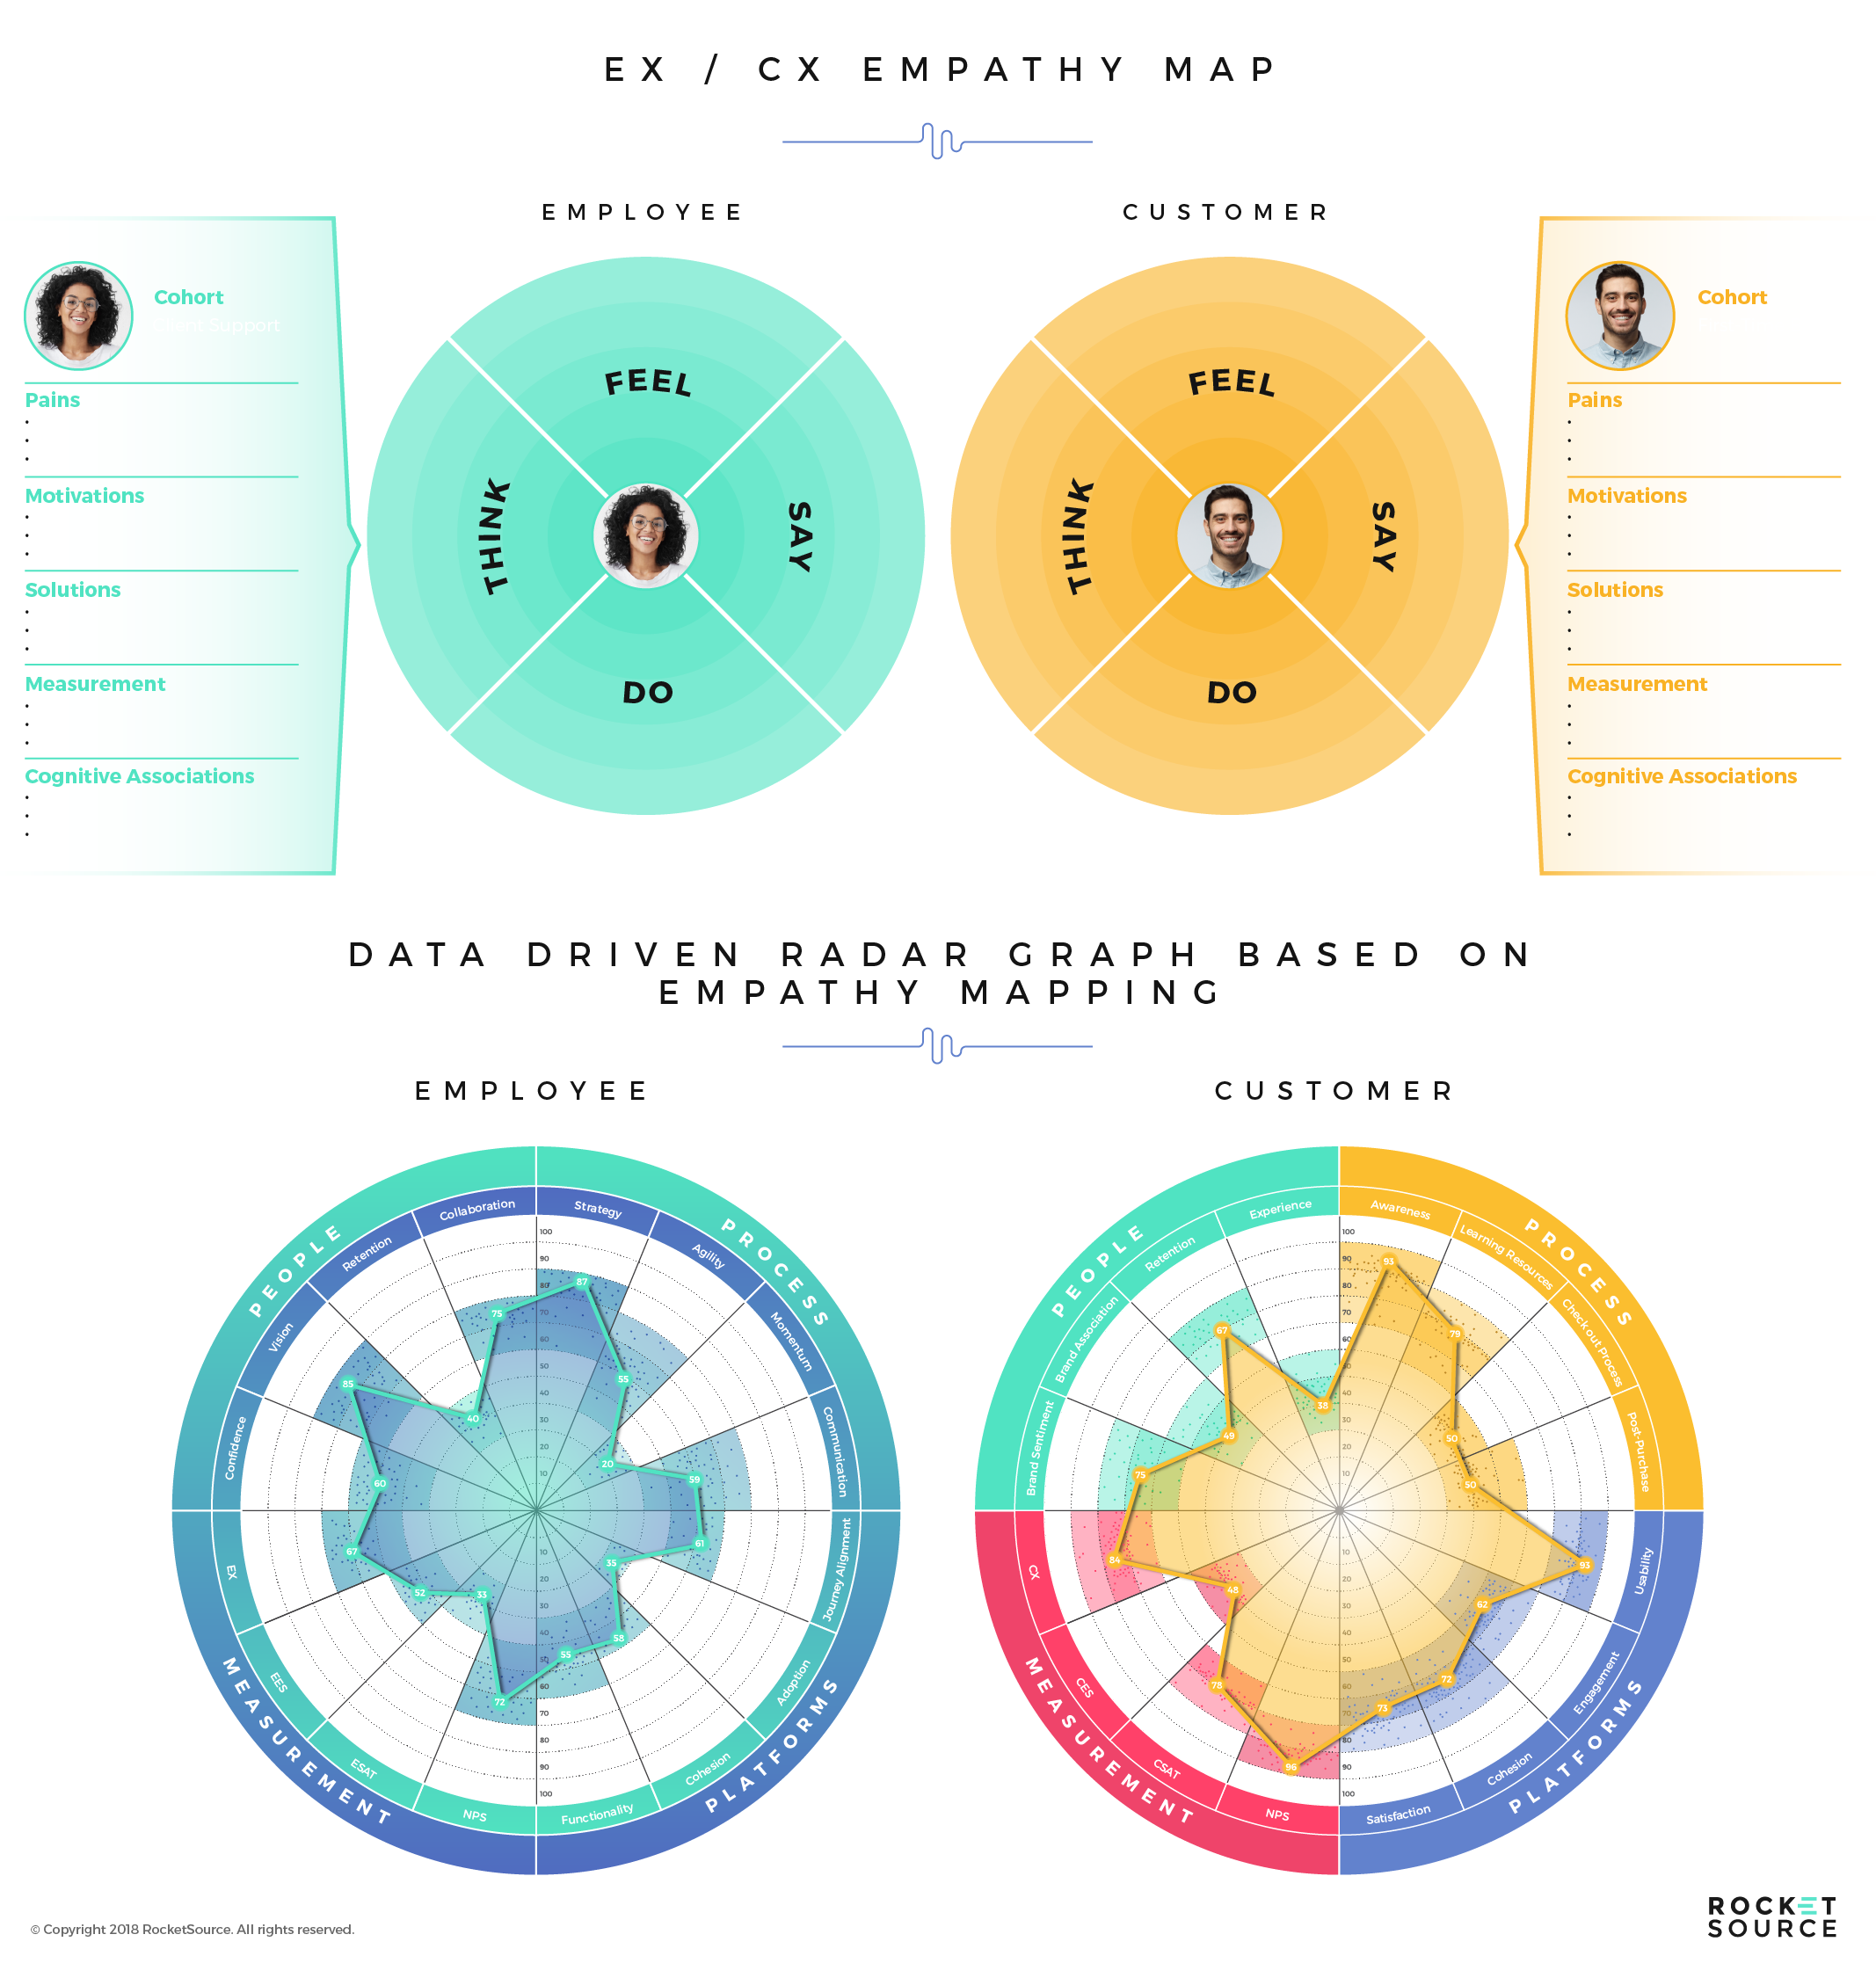
These two radar graphs represent a variety of metrics which allow organizations to gain a deeper understanding of what’s happening internally with employees and externally with customers. Data visualization, like you see in these radar graphs, enables leaders to get a snapshot very quickly. Within a few seconds, the person reading the map can see which cohort to focus attention on and in which areas. By mapping out empathy-driven data, we’re able to start visualizing where there are disconnects in the employee’s experience and find ways to improve them.
We apply this same logic to comparing and contrasting employee and customer experiences by laying proprietary experience scores based largely on these metrics on top of each other in the customer journey map we developed. My team lovingly refers to this approach to mapping data as Barlow Bands because they’re the spin-off visualization I created from Wall Street’s Bollinger Bands. I prefer to call them Convergence/Divergence bands. Whatever you call them, here’s what they look like.
The Convergence/Divergence bands offer an in-depth analysis into where there’s a disconnect with your employee and customer experiences, and where your team’s working in harmony with your buyers. As with radar graphs, mapping and visualizing experience scores in this format enables you to quickly identify opportunities for improvement and decide where to deploy your capital. You can more easily understand where you can reduce costs and friction points. As you’re innovating on the customer’s experience with your brand or products, Convergence/Divergence bands serve as guardrails to ensure strategic changes and cost reduction strategies aren’t derailing the experience for either your team or your customer.
The CIO and CMO Marriage: The Key to Better Digital Experiences and Successful Digital Transformation
As shown above, Convergence/Divergence band use isn’t limited to pairing all employee journeys with the customer journey either. They can also be used internally to see where leaders within your organization align — specifically those who are running complex initiatives. Take the Chief Marketing Officer (CMO) and Chief Information Officer (CIO) as prime examples.
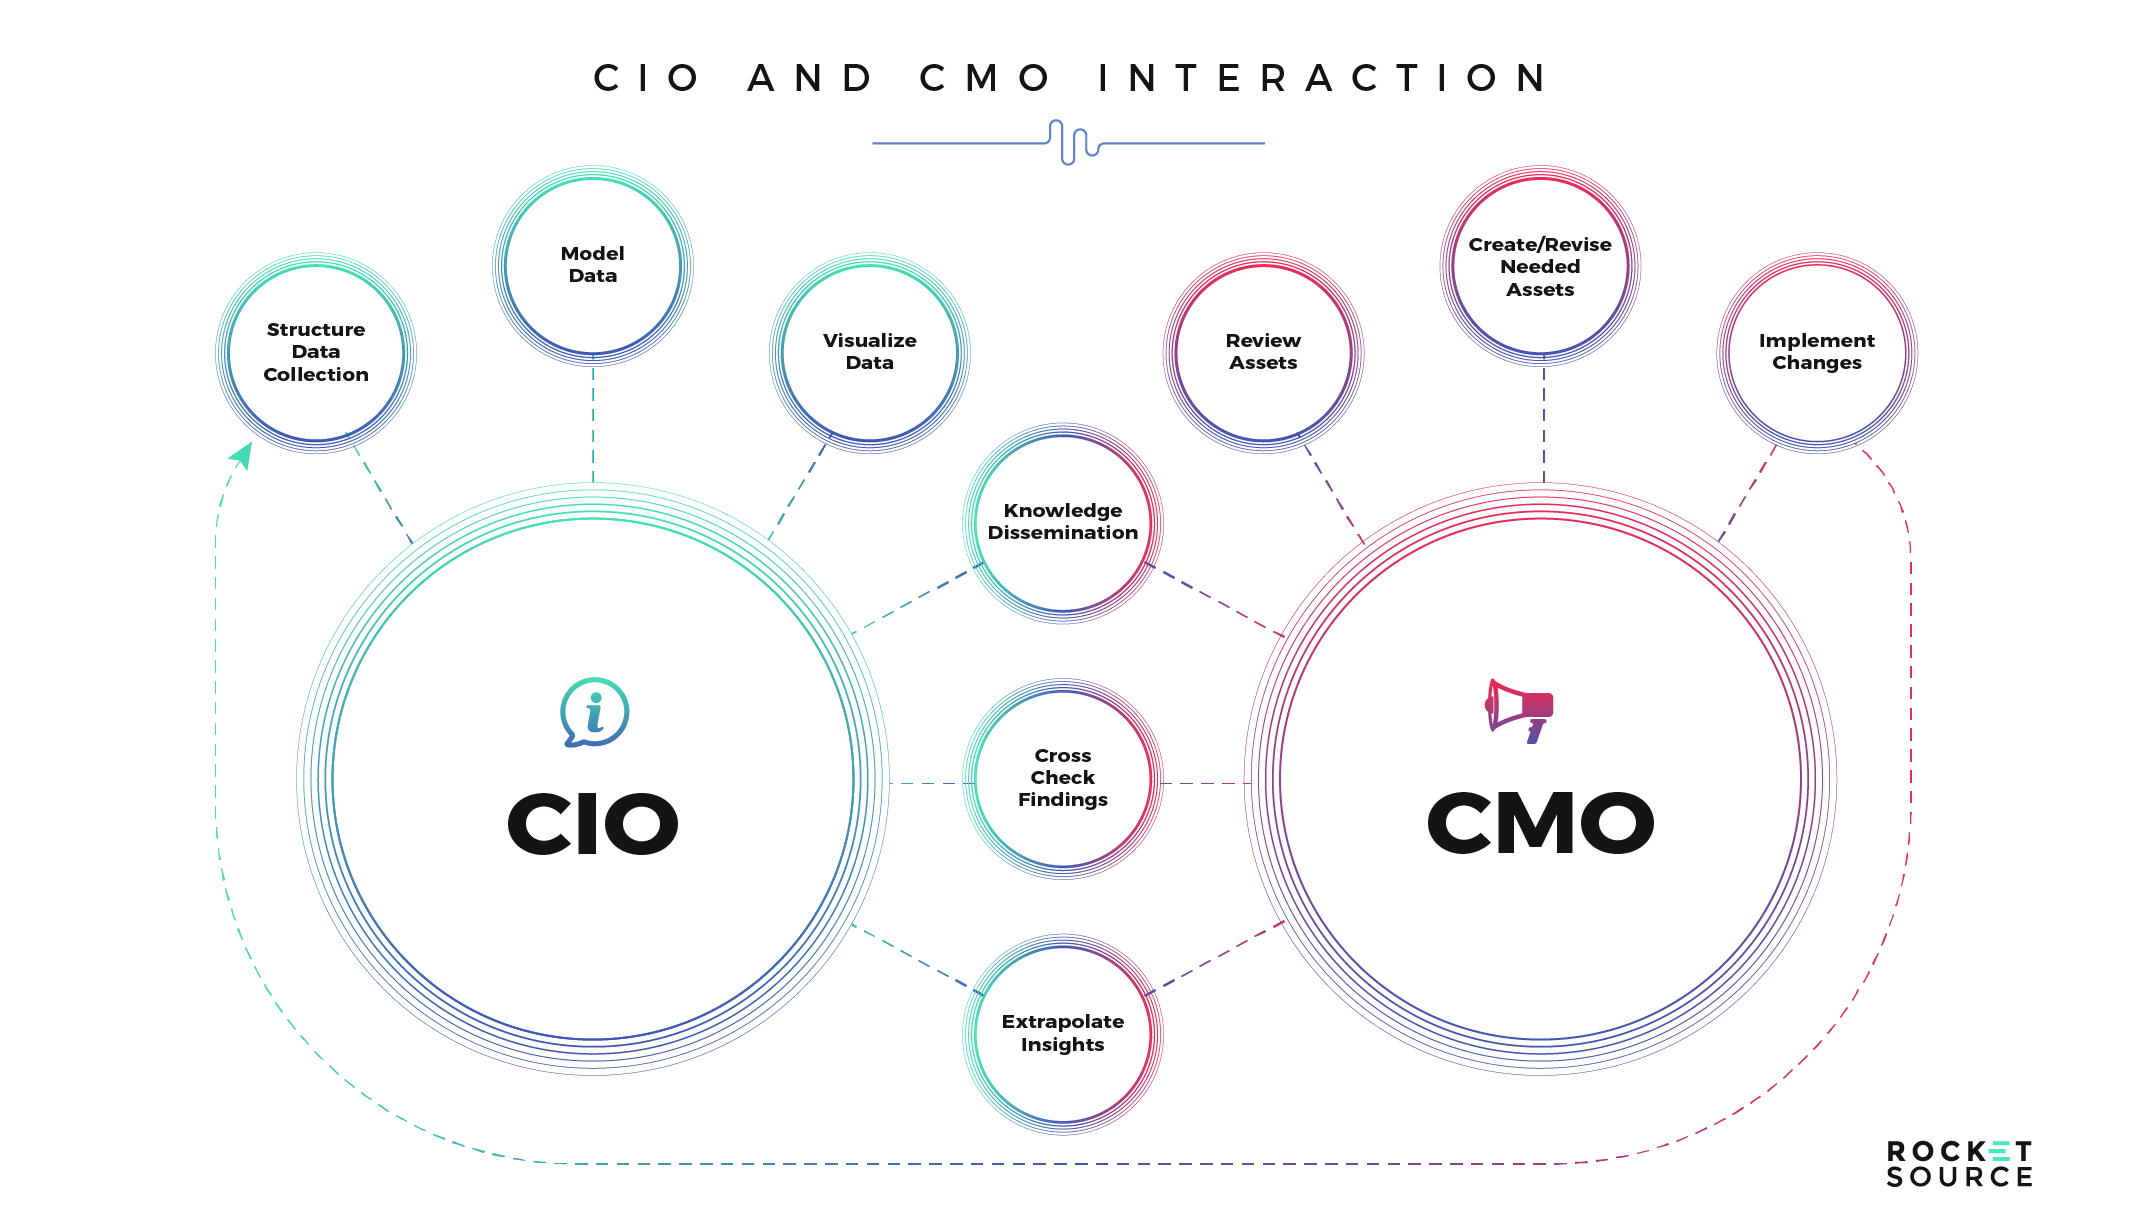
CMOs have an unprecedented amount of forward-facing customer data from which they must gain insightful direction to produce incredible digital experiences. On the flip side, CIOs must leverage platform after platform to build the big data backbone needed to generate these insights, not only for the CMO, but for the entire organization.
The problem, however, is that the CIO-CMO relationship has historically been a contentious power struggle. The demands for increased speed and delivery are usually an operational source of contention and friction. The CMO needs agile and pivot-inducing systems to manage accelerating changes in customer behavior, tastes and preferences, technology, and the competitive business environment. But for the CIO, the need for speed can have serious implications, often requiring CIOs to pivot the roadmap and operating model in order to quickly deliver the types of systems and analytical loops that drive best-in-class decision making. Sound familiar?
Although there is overlap in job functions and both executives are working toward a common goal, their boots-on-the-ground experiences vary wildly and teams can clash. Too often, these vastly different experiences go unnoticed and unaddressed. But the marriage of these two roles is the central narrative of every organization today. Both the CMO and CIO are on the hook for turning all that data into growth — together.
As both executives forge ahead, each with a unique and narrow viewpoint, they lose sight of what’s happening in other departments and in the organization as a whole. In doing so, they lose the insight needed to have empathy for the challenges faced by other departments. Mapping the CMO and CIO experiences alongside each other using the CIM and Convergence/Divergence bands, you’re able to pinpoint where there’s team cohesion and where there’s a potential disconnect — specifically around the transition from path-to-purchase to path-to-loyalty. Additionally, we can map the CMO’s and CIO’s Employee Experiences (EX) against the Customer Experience (CX) to see where those divergences are directly impacting the Customer Experience and ultimately the Brand Experience (BX) across the journey.
If that last sentence doesn’t resonate, perhaps you should read it again, because there is NO other Customer Journey Map or Customer Journey Mapping exercise we know of that goes into our level of detail and insight.
Here’s what a map like that could look like.
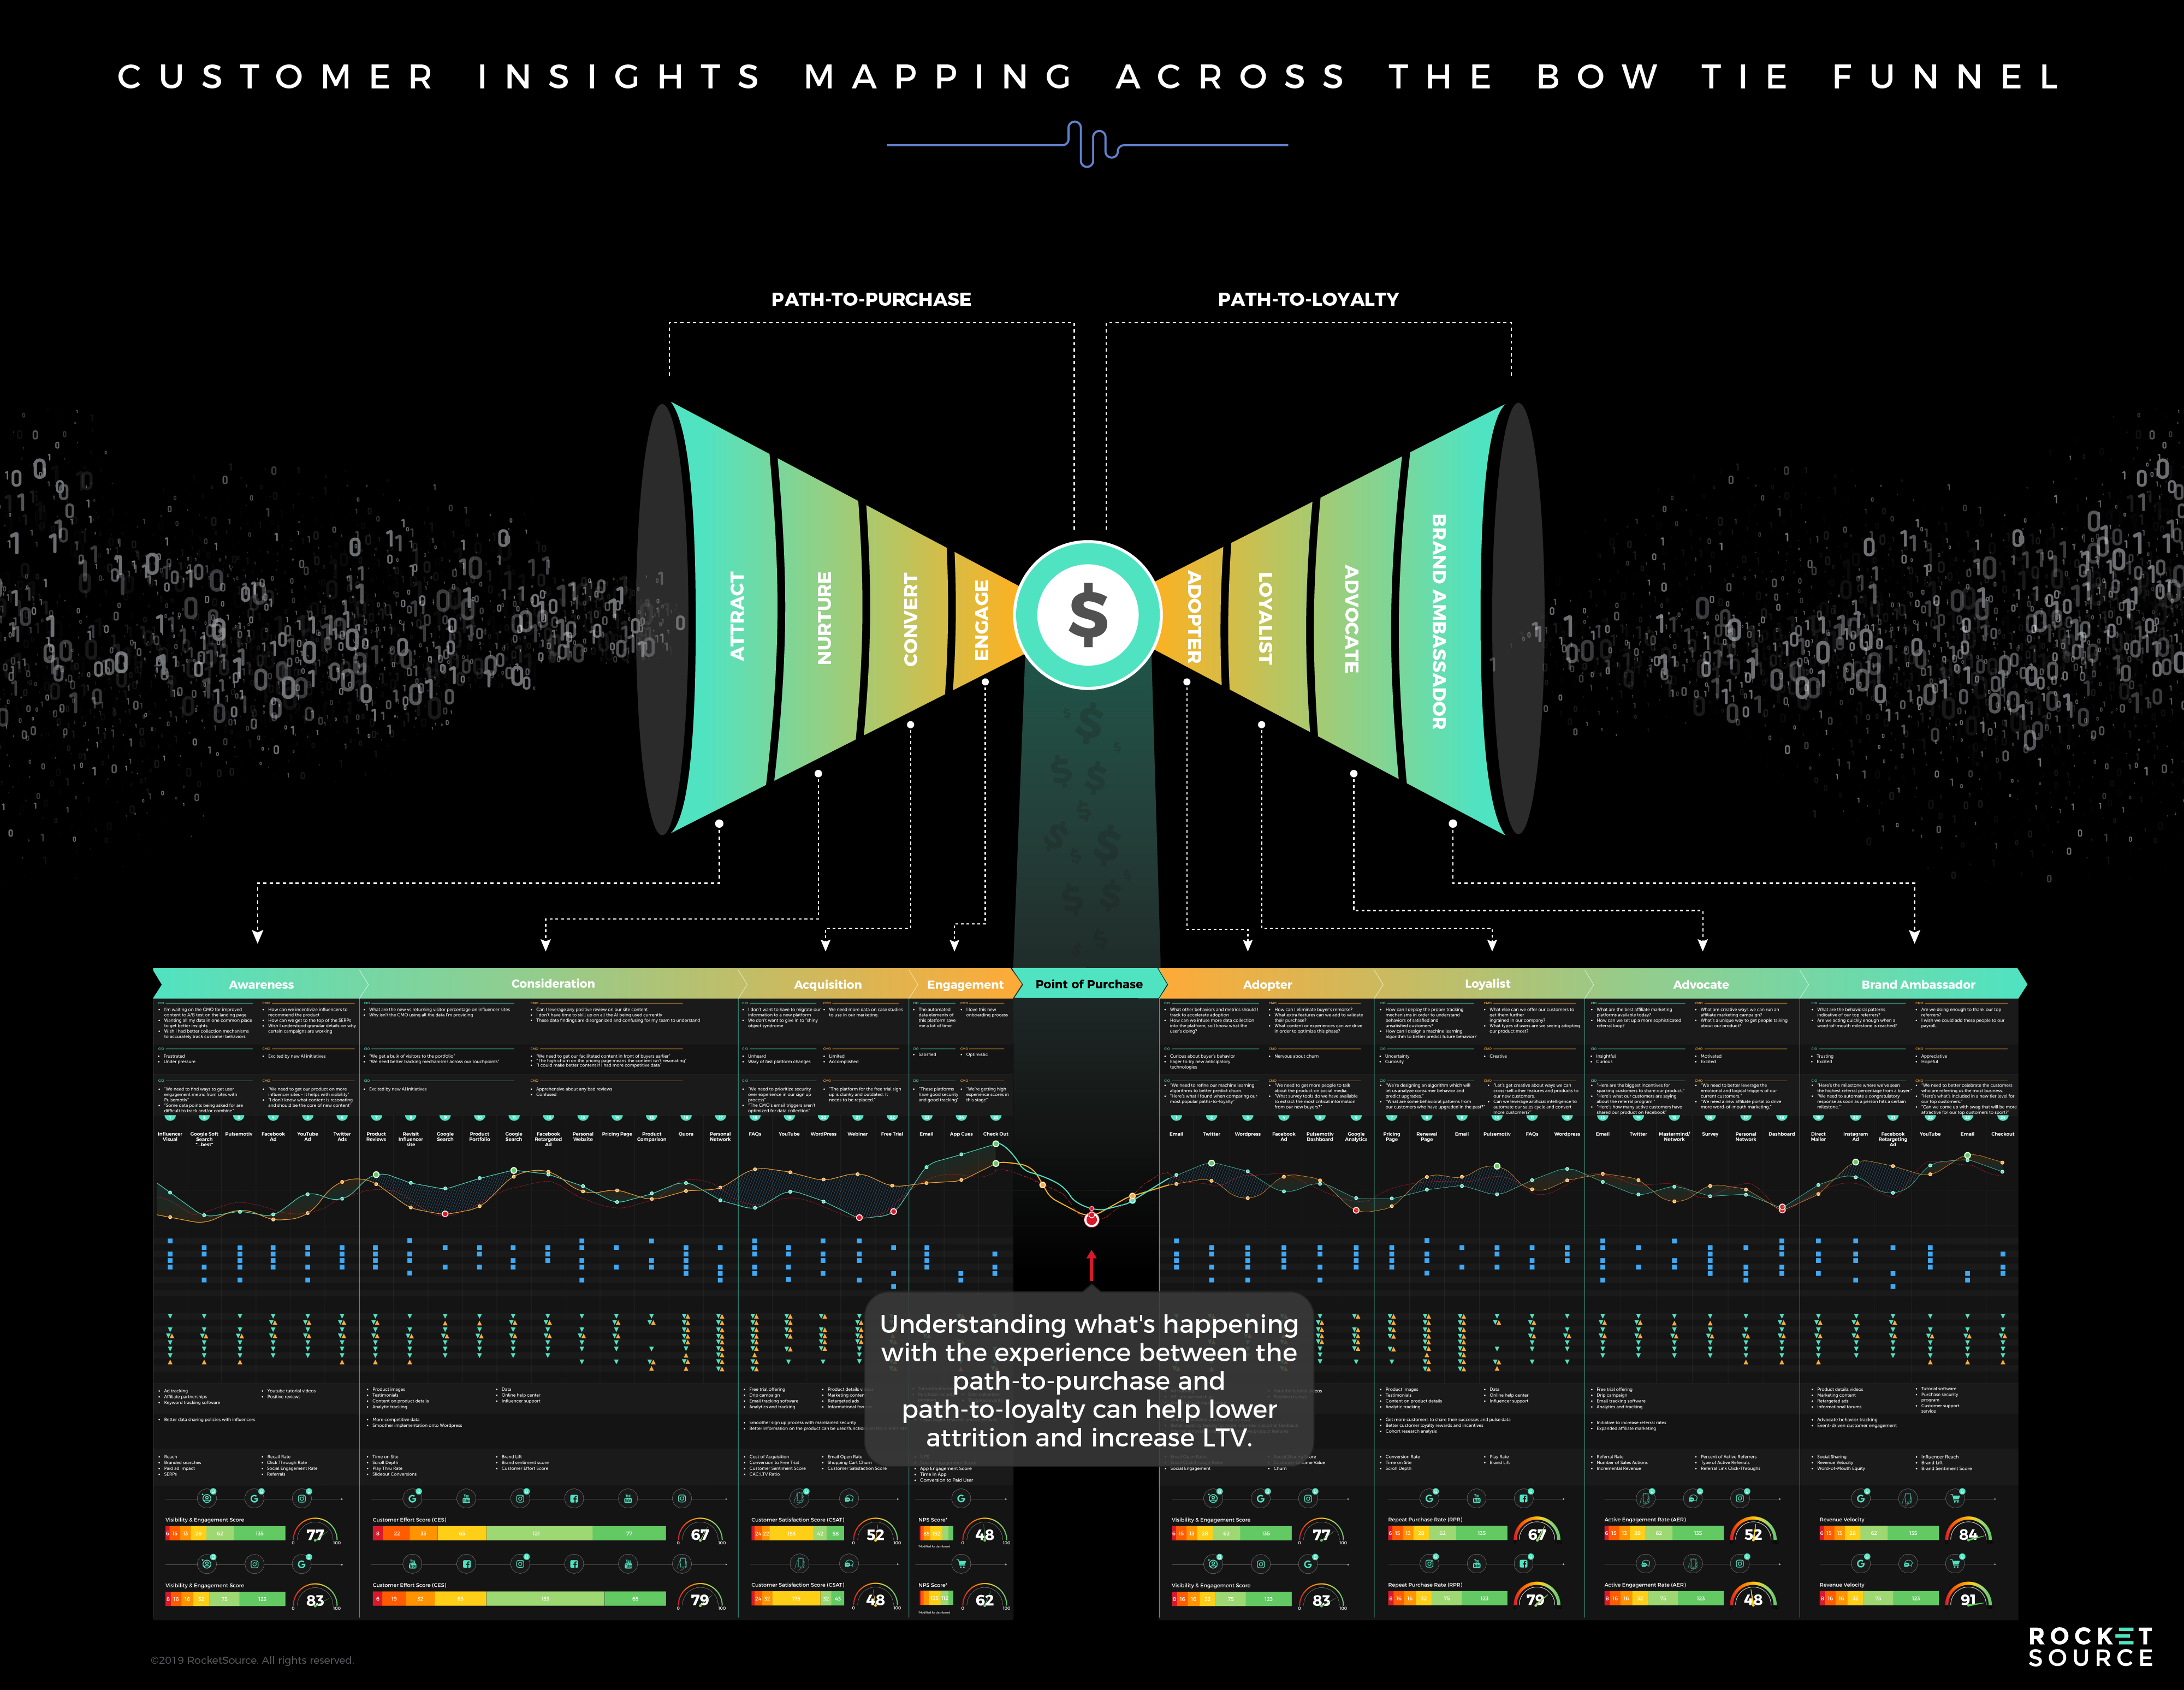
I want to draw your attention specifically to the middle of this map. Remember the bow tie funnel I mentioned earlier? Here’s where it comes into focus.
Many times, a customer and employee experiences drop immediately after the onboarding process wraps up because the enthusiasm generated during the initial conversion wanes and new work needs to be done to nurture that customer. That drop is vital as you consider a more impactful way of leveraging the Customer Insights Map beyond conversions alone — to reduce attrition and increase LTV. Comparing and contrasting the experiences of mission-critical employees alongside the customer’s experience gets you closer to that end goal.
Let’s zoom in closer, shall we? Let’s say right around the Point of Purchase.
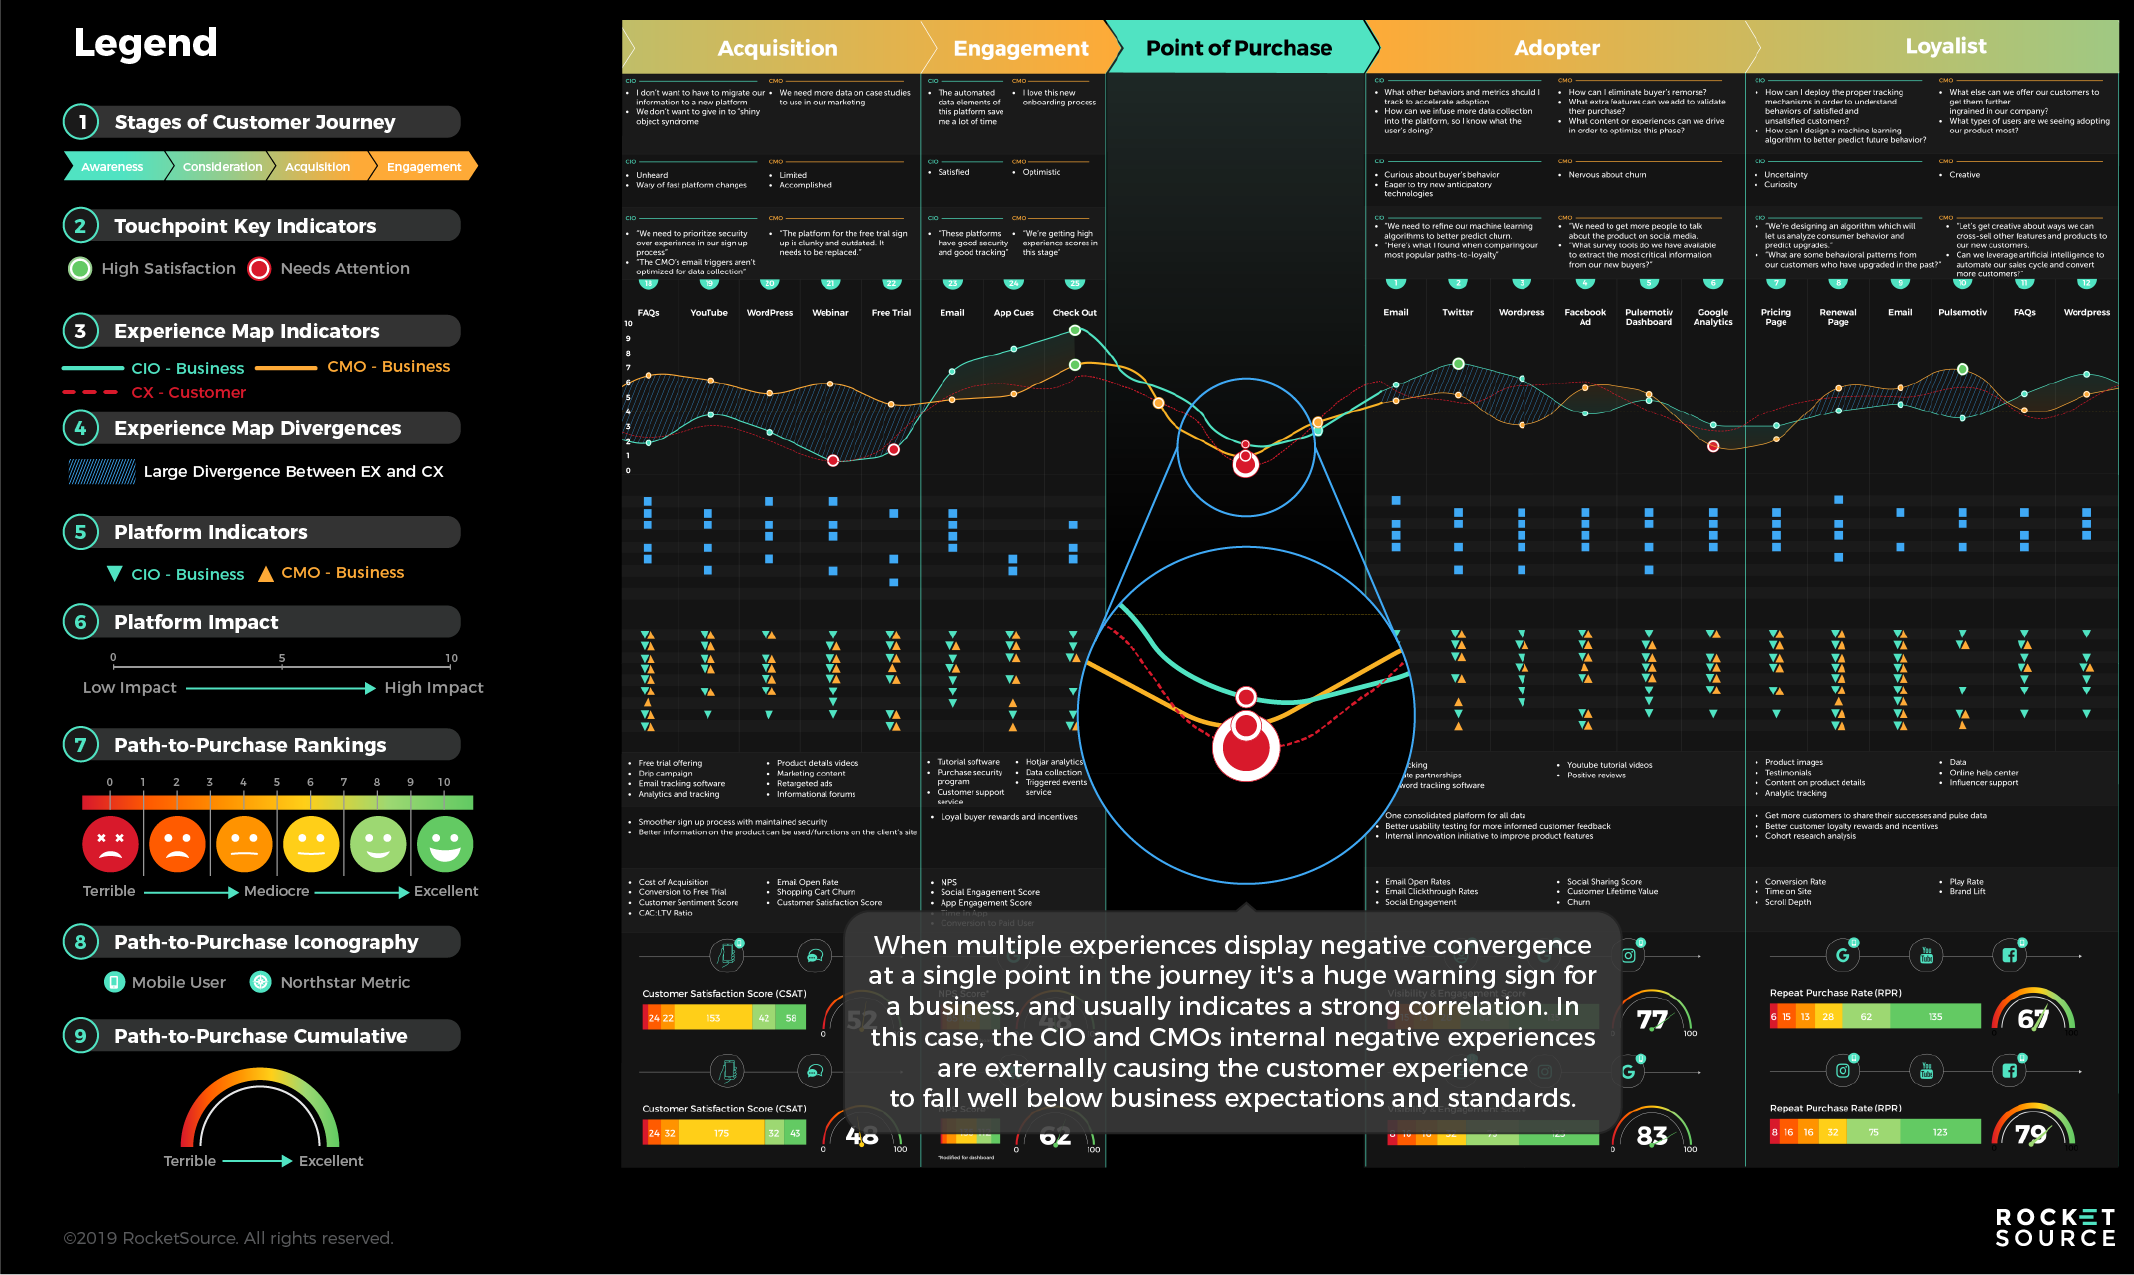
You can see what the blended data looks like in action. Here, the negative journey experiences of both the CMO and CIO office converge to negatively affect the customer’s experience. Although these EX/CX convergence data are typically a lagging indicator (since data is typically not real-time in CX), these data and data visualizations are extremely powerful organizationally, especially to the C-suite.
By layering these three experiences — those of the CIO, CMO, and customer — you’re able to see where steep drops happen, where the scores or paths converge/diverge, and where things are going well or poorly. In recognizing these contrasts, you’re able to find areas where both executives should focus, make changes, and reevaluate customer and internal needs.
However, identifying areas of opportunity is just the first step. Building out these maps with the correct data and communicating a strong story across the organization is what translates these needs to the organization, making the findings actionable instead of theoretical. To know where to start, you must run a thorough gap analysis and/or data audit first, otherwise the foundation (and perhaps even your data loops) will be fundamentally shaky. And, as we all know, dirty data in = dirty data out.
This level of detail may seem daunting, but it gives you a glimpse into the future of customer journey analytics.
Improving Experiences With a Gap Analysis
Recently, we made a presentation to an executive at a large bank here in Salt Lake City. When we presented our updated Customer Insights Map and, more specifically, the Convergence/Divergence bands, he was impressed, but he had some good questions about how he’d implement them in his organization. One of his top concerns was getting the right data into our version of a customer journey map. He isn’t alone in this concern and was right to bring it up.
Businesses of all sizes today are facing veracity of data issues, which have created inconsistencies and ambiguities. Disparity, accessibility, integrity, decipherability, sparse instrumentation, biases, data lineage, bugs, sources, methods, data rot, human error, noise, and more have made it difficult for organizations to hone in on accurate insights. I wish there was an easy way to navigate these hurdles, but there’s not. Overcoming the data veracity beast is dang near impossible if you can’t gain buy-in from your team, which is why one of the first steps we take when doing any Customer Journey Mapping exercise is to run a gap analysis of the 3 Ps — people, processes and platforms.
A gap analysis is a way of assessing whether you have the right systems and software in place to gather the information needed, and whether your people are primed to receive the results. It helps you understand if mapping your data on an asset like the Customer Insights Map will get adopted and democratized across the organization in the first place.
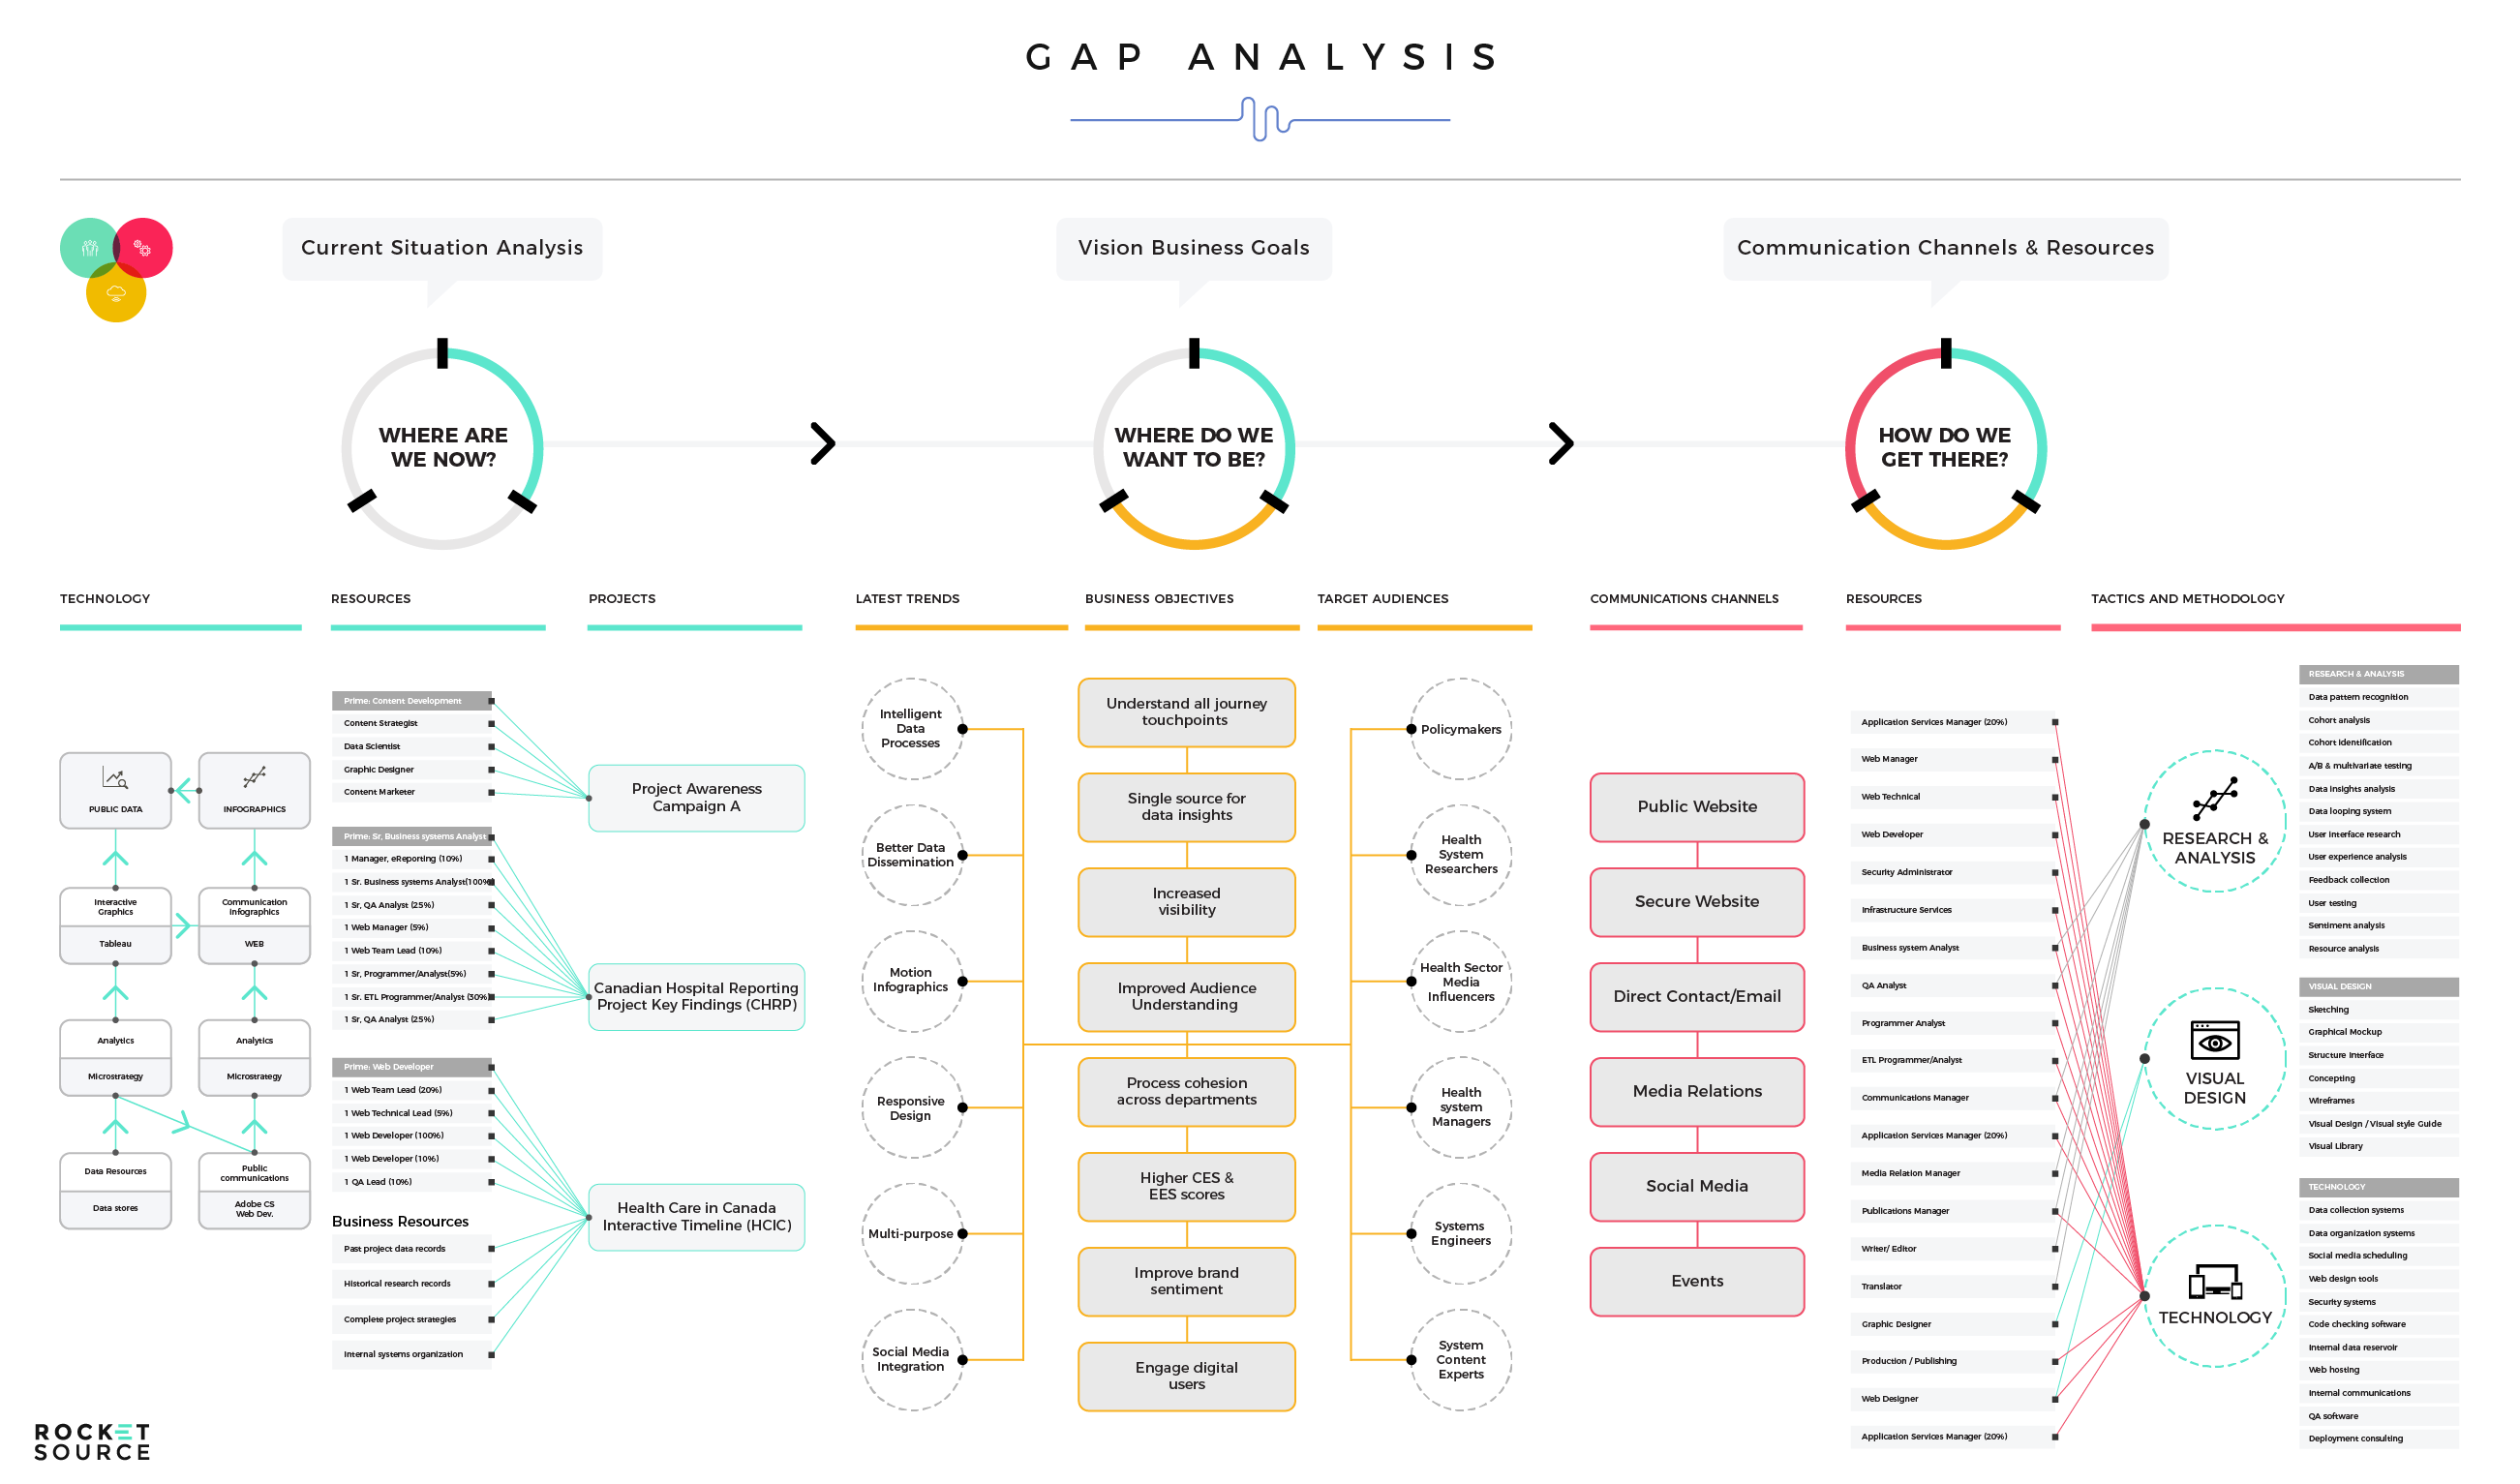
I’ll be the first to tell you that an analysis like this is pretty sophisticated. It takes a lot of time and work to finalize, but the work is worth it. Once you have a gap analysis under your belt and you have confirmed you’re able to gather the necessary data and gain buy-in from your team, you can start building the engines required to map out experience scores across the journey. These engines include your content engine, your search engine marketing (SEM) engine, your data and analytics engine, and the list goes on. With these engines in place, you can then build in analytics to better understand what’s happening along the buyer’s journey. In the beginning that will look like your Customer Effort Score (CES)/Employee Effort Score (EES), Customer Satisfaction Score (CSAT)/Employee Satisfaction Score (ESAT), and the ever-popular Net Promoter Score (NPS). These are the basic dashboard metrics needed to start understanding your experience scores and mapping your Convergence/Divergence bands.
None of the work of mapping your customer’s journey is worthwhile unless you do the heavy lifting up front. Collecting data on a one-off basis doesn’t work. You must build a sophisticated data loop paired with data governance to ensure the data stays clean. In taking these measures on the front end, you’ll have the insights needed to start finding opportunities for transformation.
Transforming the standard funnel of yesterday into a truly insightful analytics tool requires sophisticated data looping.
Yes, this exercise requires heavy lifting, but here’s the beauty of it — going through an exercise like gap analysis as a team makes a lasting impression. Walking through something this complex will more often than not serve to make your team stronger. As you map out experience scores and visualize those convergences and divergences, you’ll naturally build momentum among your team and continue to build buy-in for your next experience initiative.
When we examine a customer journey map from a brand experience perspective, we start to see things through the lens of the transformation framework, StoryVesting. StoryVesting requires that organizations infuse the human element into data sets, which is precisely what happens when you take an empathetic stance to your team’s experience and analyze your organization via the 3 Ps — people, processes, and platforms. This perspective shapes how you regularly digest critical metrics regularly and leverage the insights gleaned for the future. Departmental alignment becomes tighter, which helps shape how your organization will evolve going forward, including how the market will adopt and attach itself to your organization’s offerings.
Increasing the Stickiness of Your Product
Intelligent operations are fueled by just that — intelligence. It might sound like I’m stating the obvious here, but in reality, many companies struggle to know where and how to infuse the unprecedented amount of data we have at our disposal today. To help navigate that struggle, the Customer Insights Map has customer journey analytics included in the design. In previous posts on this blog, my team has shared the basics of the importance of customer journey analytics. Now, I’d like to scratch a little further below the surface to show you why these analytics are such an integral part of any mapping exercise.
Google Analytics Isn’t Telling You Enough About Your Customer’s Journey
Most companies I talk to lean heavily (if not exclusively) on Google Analytics to understand what’s happening along the buyer’s journey, and they’re not alone. At the time of this writing, 27,725,874 live websites use Google Analytics to understand their customers better and optimize their pages. The search giant isn’t naive to the idea that organizations want access to this data and delivers a piece of what’s needed to help optimize the digital experience.
I use Google’s products myself for analytics. Before the specific product Google 360 gated their offering, I was able to pull some terrific insights. Here’s an example of what I gleaned.
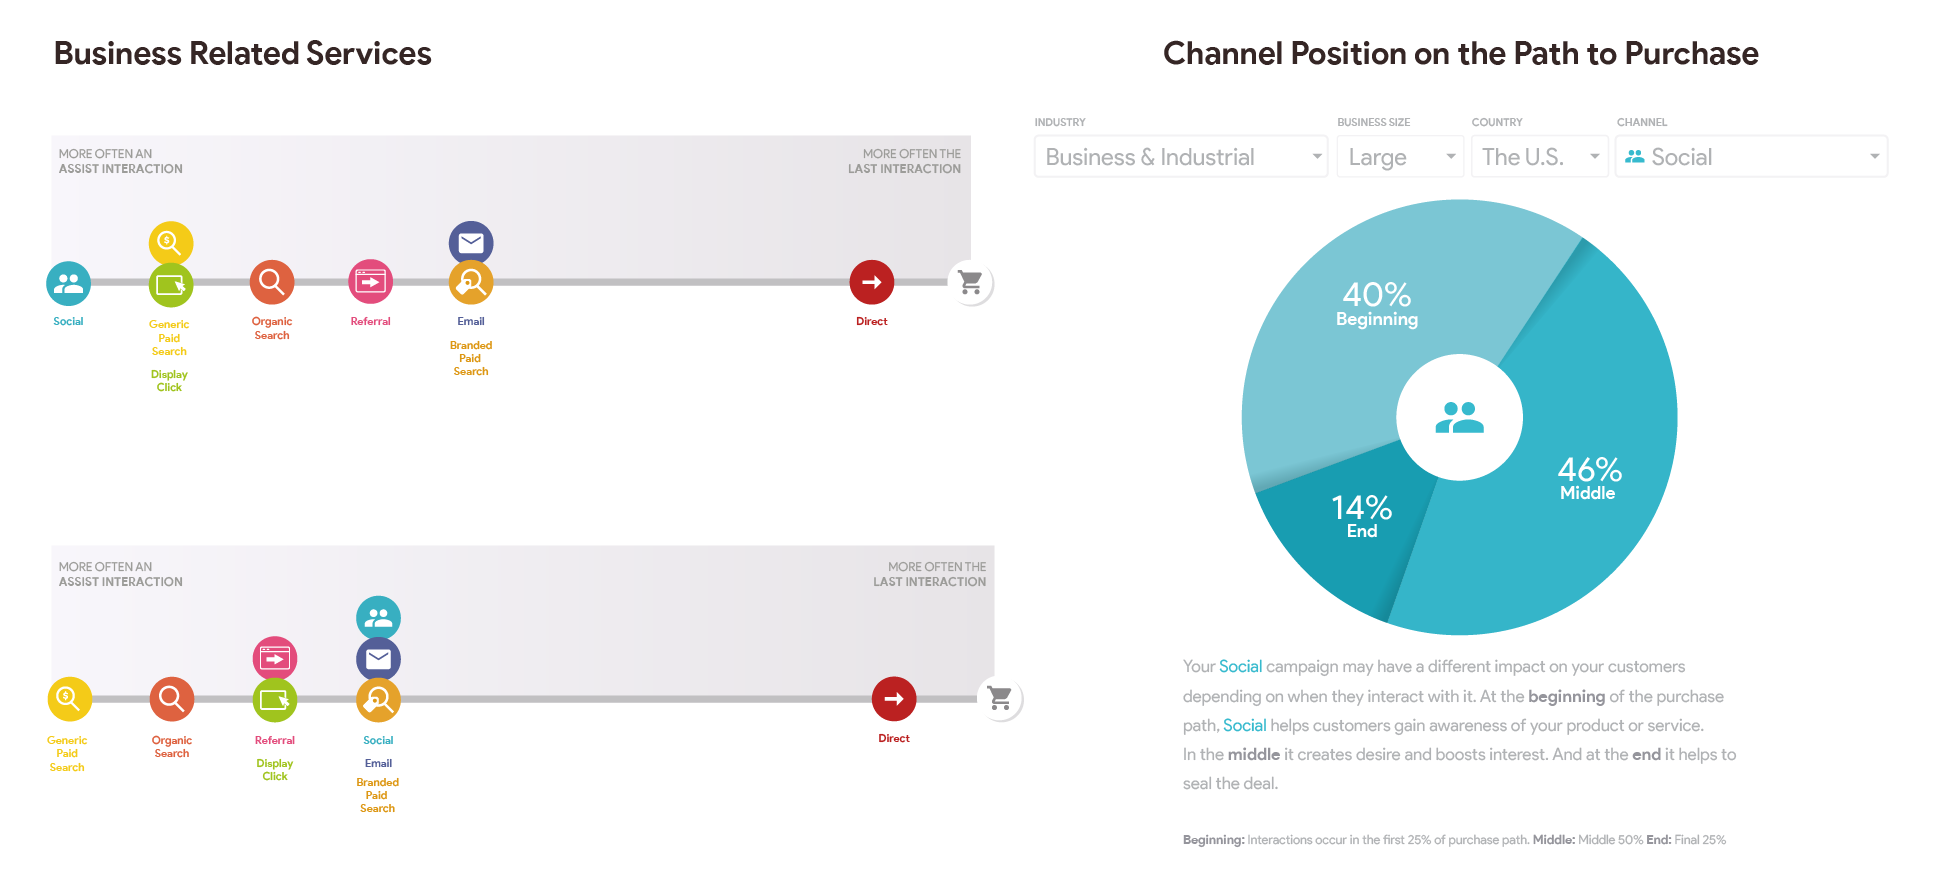
In this screenshot, you can see that the way people interact with the funnel is specific to industry and size of business. Specifically here, we’re looking at a large company in the business or industrial sector. Take note that the path-to-purchase starts on social media. Although insightful, knowing that customers start their journey on social media probably isn’t a surprising find. What is surprising is that this isn’t where social media usage stops. 46% of the time, the touchpoint comes in again in the middle of the buyer’s journey, and 14% of the time at the end of the journey. That means people aren’t just finding products via a social media advertisement. They’re deciding which products to buy on social media, too, and making it one of the last touchpoints before visiting the checkout page.
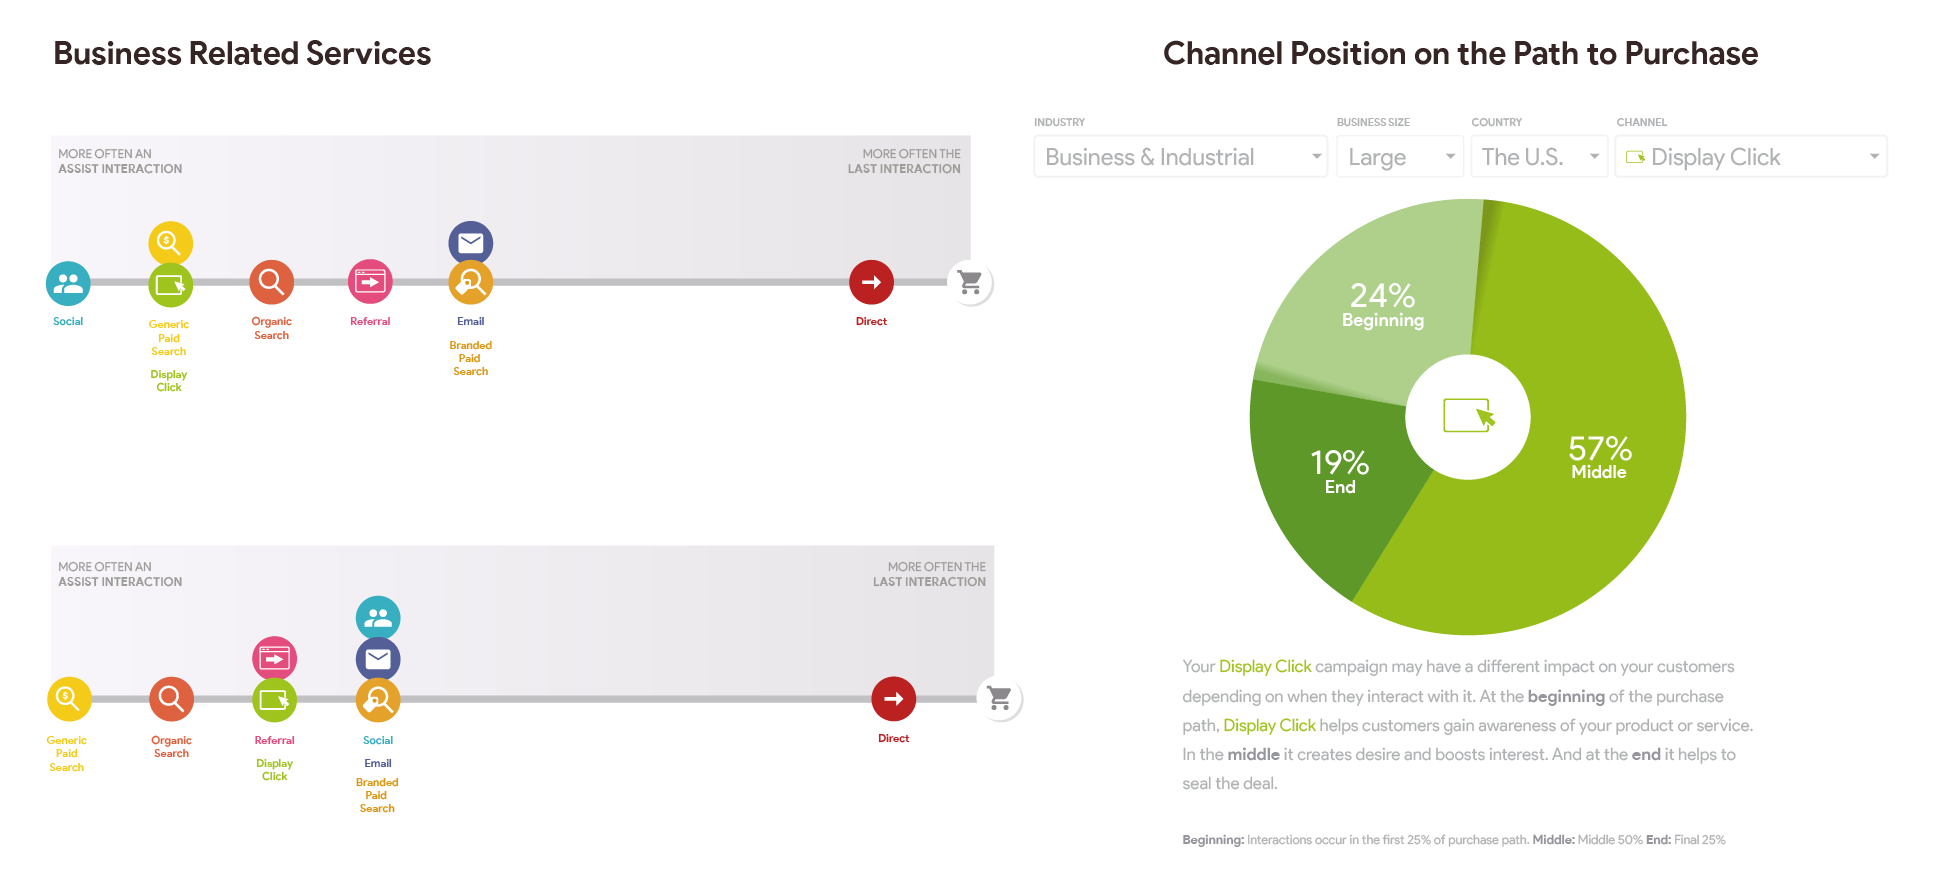
Now, look at one more screenshot I was able to pull. You’ll see here that display ads are also one of the last touchpoints.
Why is that? How is it possible that the modern buying journey can both begin and end on social media? There are a few reasons; our behavioral patterns haven’t changed as much as we think they have, but the way organizations reach consumers has. Let me explain.
Same Consumer Behavioral Patterns…
The first part of the journey is behavioral in nature. Consumers use social media to gather information about a purchase before they feel ready to whip out their credit card. However, there’s more to it. In spite of how much our ecosystem has turned digital, consumers continue to be creatures of habit and revert to traditional ways of operating. While fundamental habits won’t dramatically alter, the platforms on which we put those habits into motion will.
We now spend more time on social networks, just like men used to spend hours in the barbershop catching up with friends or women at the hair salon. I know because my mother is a hairdresser and I’d often tag along with her to work. I saw how people engaged offline before digital transformation started to unfold, and I’m seeing those same patterns of behavior on social media now. Large brands see this too, which is why they continue to leverage social platforms to get in front of customers at every stage of the journey, not just at the beginning.
…Different Response from Businesses
The second reason the modern buying journey ends on social media relates to the way these organizations target today’s consumer. Companies of all sizes are using Facebook’s retargeting pixel and the ability to mash up data to figure out new ways to reach the end-user.
Brands know consumers today are distracted, so they help move their buyers along by continuing to target them after the buyer has shown initial interest. This forward push in the journey is done using a strategy called retargeting, which continues to display ads to the buyer as they make their purchase decisions. Then, at that magical moment when the customer is ready to make a purchase, they will often see the brand’s advertisement again and leverage that easy access to what they need, clicking away from social media and to the checkout page to buy. Again, if it weren’t for the retargeting pixel of Facebook and the huge success they’ve had in advertising adoption, this data would be completely different.
These are excellent insights from Google, and because they come from the search giant, it’s safe to say there’s a healthy amount of statistical significance behind the analytics they provide. The weakness of these insights is that they only paint 1% of the picture. There’s still 99% more work that has to be done at the organizational level.
Google Analytics can only tell you about how the customer moves through the funnel, but it’s not going to help you understand the “why” of their behavior. Knowing the “why” is what will help you understand how to make your brand stick in the minds of consumers and increase the lifetime value of that buyer. For this reason, the analysis must go well beyond Google data and take into account behavioral psychology, macroeconomic trend analysis, and more. The idea of adding depth to your analysis is precisely the approach we take via the StoryVesting framework, which is why we have incorporated StoryVesting into the Customer Insights Map.
One man who understood this concept better than anyone was Steve Jobs. While marketers were spending disproportionate amounts on advertising, messaging, and building brand awareness, Jobs dug a little further beneath the surface to try to understand the true motivations behind consumers’ behaviors. When asked about why he didn’t invest heavily in traditional research studies, he answered with his famous quote:
”It isn’t the consumer’s job to know what they want.” – Steve Jobs
In line with Jobs’ approach, I am constantly looking for patterns and digging deeper than what any consumer will tell me they want out of a business. By combining scientific and psychological data, I’m able to use pattern recognition to guide innovations for acquisitions by private equity groups and venture capitalists. Leveraging processes and methodologies via a customer journey map and the Hoshin method allows my team and I to compare and contrast what’s happening along the buyer’s journey from a behavioral, psychological level. I usually do this myself and with my team behind-the-scenes, but now I’m bringing it to the world, showcasing a way to map how you’re spending/deploying your capital via analytics that goes deeper than what you’ll find from Google’s free tools. I do this by looking at path-to-purchase analytics.
Analyzing Path-to-Purchase Analytics to Guide Digital Transformation
If you’re already familiar with the fundamentals of path-to-purchase analytics, feel free to skip down a few paragraphs. If you’re somewhat new to the world of path-to-purchase analytics, welcome! There’s a lot of good stuff here. I could easily write an entire post on the art and science of analytics and probably will someday. For the sake of this post, I won’t go into all of the nuances behind these analytics. Instead, I want to draw your attention to how you can leverage path-to-purchase alongside your customer journey map because that’s what the crux of this post and asset is really about — understanding your customers better so you can make more informed business transformation decisions.
One important distinction I want to make right off the bat is the difference between customer journey analytics (which I talked about above) and path-to-purchase analytics. Journey analytics help you better understand the overarching experience. When you analyze the path-to-purchase, you’re looking more closely at the series of touchpoints and channels a buyer goes through when engaging with your brand and at which path makes the most sense for the initiative you are running (i.e., fastest path vs. most profitable vs. highest NPS, etc.). The sequence of those touchpoints and channels is critical when it comes to helping you better understand how a person progresses in their relationship with your brand.To illustrate the importance of looking at the path-to-purchase specifically, take a favorite retailer of new parents — Target.
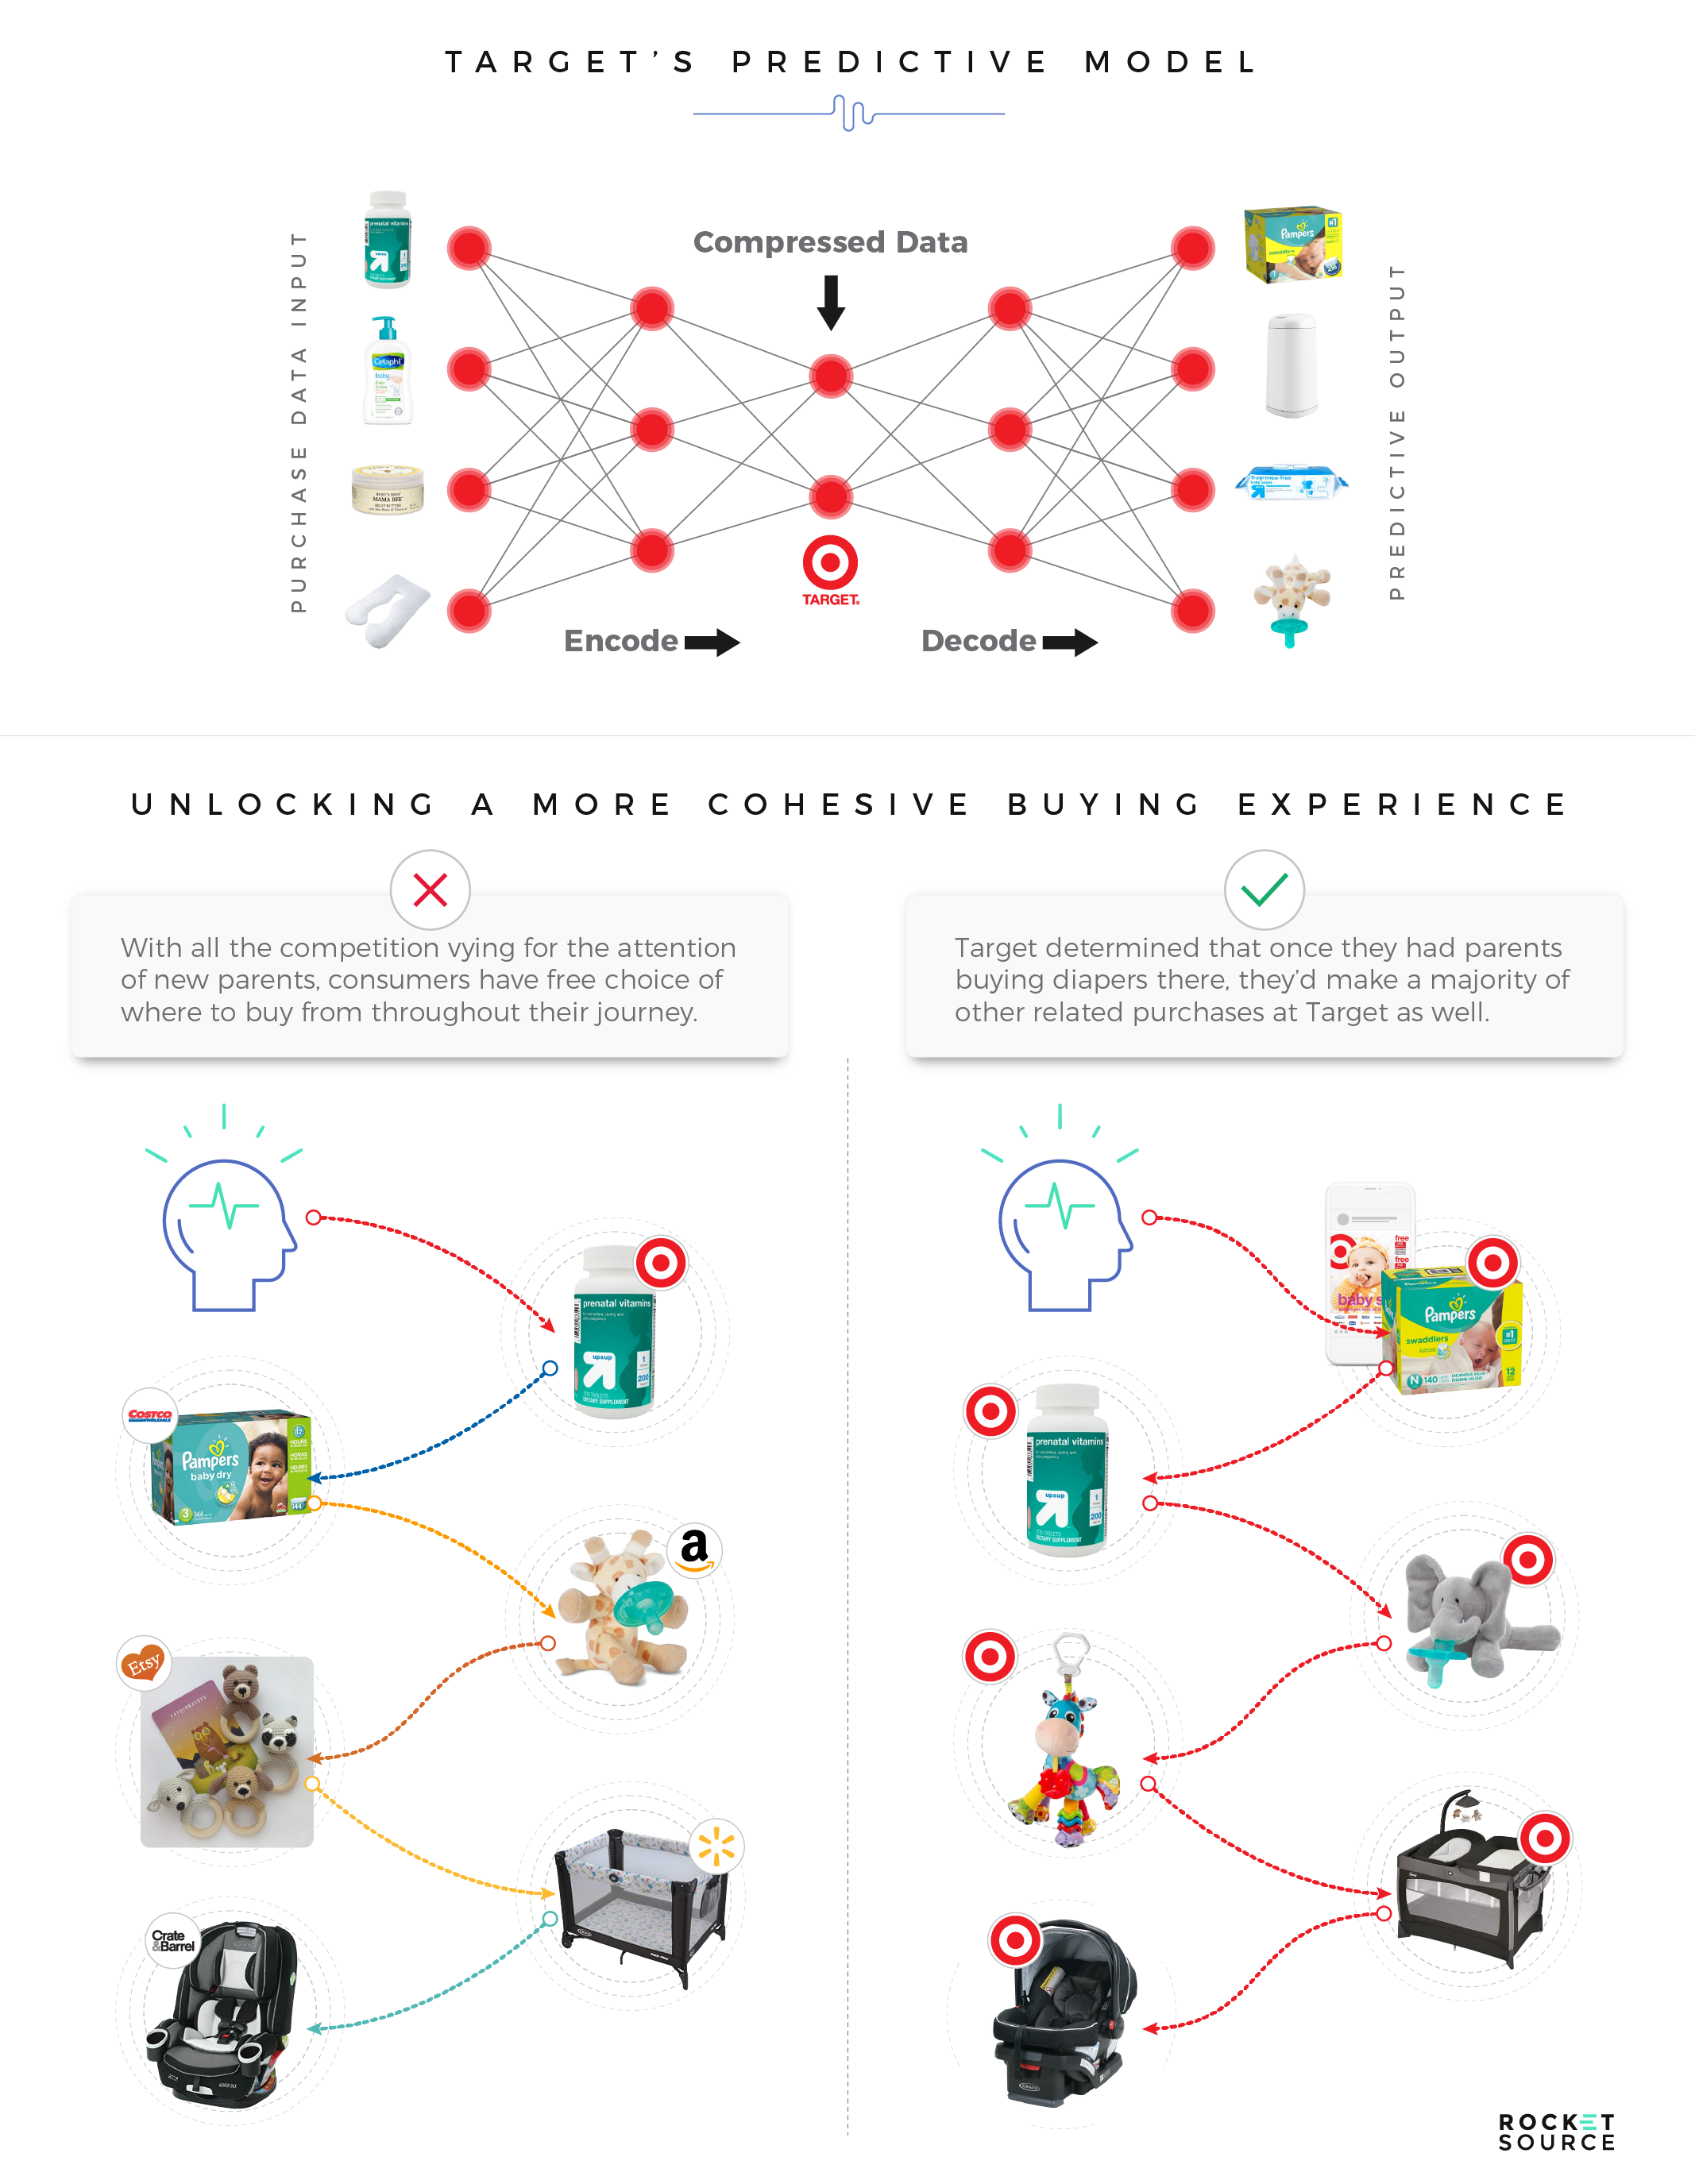
Back in 2012, Andrew Pole, a famous statistician at Target, was interviewed by the New York Times in an article which described a very specific challenge Target had — breaking customers out of their current shopping habits. Many legacy organizations and disruptors alike face that same hurdle, but Target’s response was a little different. Pole and his team dove headfirst into path-to-purchase analytics to find an approach that would boost their competitive advantage. Specifically, they honed in on a cohort which was most likely to alter their buying behavior — new parents whose life was already completely in flux and who were desperate for an easier way of doing things.
Target certainly wasn’t the first brand to narrow their lens around new parents. If you’ve had a baby recently, you know the influx of marketing materials and paraphernalia you’re bombarded with by brands vying for your attention. This is due to the saturation and intense competition in the parenting market. Getting in front of a new parent early on in pregnancy is the key to generating a longer lifetime value of the user. Pole had this to say about the approach:
“We knew that if we could identify them in their second trimester, there’s a good chance we could capture them for years. As soon as we get them buying diapers from us, they’re going to start buying everything else too.”
To be the first retailer in the new parent’s mailbox, Pole used pattern recognition to analyze the commonalities in purchase decisions by customers who were expectant mothers registered with Target. In the process, he noticed that several common items — 25 to be exact — were typically purchased a few months before creating a baby registry, such as unscented lotions and health supplements. The data offered such deep insights about pregnant women’s purchase behavior that he was able to accurately estimate the trimester of her pregnancy. Target then used that data to send hyper-relevant ads at specific stages without having to wait for the customer to share their due date. Target’s growth from $44 billion in revenues in 2002 to $67 billion in 2010 may be in part attributed to this one strategy.
This pregnancy predictor was almost too accurate and caused a public relations crisis after the retailer famously predicted a teenager’s pregnancy before her father knew she was due. It didn’t take much further analysis to recognize that customers were ‘creeped out’ by how much insight the retailer had on their lives. To combat that crisis, they continued using the data to send ads to expecting parents but softened their approach by adding unrelated ads alongside those for baby items.
The amount of data we have at our disposal can offer up almost unbelievable levels of insight into the lives of our buyers. The problem is that it takes a lot to translate data into something useful and transformative like Target did.
Plenty of thought leaders, such as IBM, ClickFox, and others in this space, continue to work hard at mastering the art of data and analytics to transform the customer experience. However, these companies are trying to make insights and analysis seem as easy as a push of the button. Sure, these platforms are great and powerful, but they can only be as powerful as the people behind them. If Pole didn’t know specifically to look at the types of products women bought early on in pregnancy, he never could’ve pulled out this type of insight.
No platform will be able to tell you what’s needed to make intelligent decisions. It takes human creativity to understand where and how to show up.
To illustrate this point, let’s look specifically at how IBM approaches customer journey analytics via their tool Watson. Here’s a screenshot of Watson’s customer experience analytics as published on G2 Crowd. Beautiful, isn’t it?
They’ve built a robust system which breaks up the customer’s journey into various segments and analyzes what’s happening at each stage — and they’ve done so beautifully with these colorful bubbles. You can tell from our header graphic and how we’ve visualized our StoryVesting framework that we like bubbles around here too, and there’s a good reason for this preference for circles.
Circular designs simplify the complex. Th is has been true for centuries, dating all the way back to the Fibonacci sequence and probably even further. Venn Diagrams are another example, and there are dozens more cases of using circular designs to simplify sophisticated concepts. The reason we use circles or bubbles is that it helps people understand complicated datasets much faster. As you saw above, IBM’s Watson uses bubbles to visualize the path-to-purchase. With the Customer Insights Map, we use bubbles over the map with different colors and dotted lines to show what’s happening along the path-to-purchase and path-to-loyalty. We also use bubble maps for business impact analysis, innovation looping/mapping and roadmaps.
The ultimate goal, however, isn’t to create something which looks good, but rather to leverage the speed of technology and the around-the-clock work of AI to uncover behavioral sequences in real-time. This approach is compelling, which is why we’ve iterated on it to get more in-depth with the insights available. Pairing data instances together, we can look at the path-to-purchase and path-to-loyalty holistically. I talked about the bow tie funnel earlier, but for most marketing groups, this funnel is just a visual representation of the buyer’s journey. The Customer Insights Map lets you dig deeper and get a more detailed view.
Developing a Customer Insights Map with path-to-purchase analytics aligned with journey analytics is a vital part of the foundation needed to guide your transformation efforts and build stickier brand experiences. By leveraging experience scores alongside channel analytics, organizations can get a 360-degree view of what’s going on with customers and employees. Simultaneously, having a modern customer journey map steeped in analytics allows teams to make more intelligent decisions faster.
Now take a look at our approach.
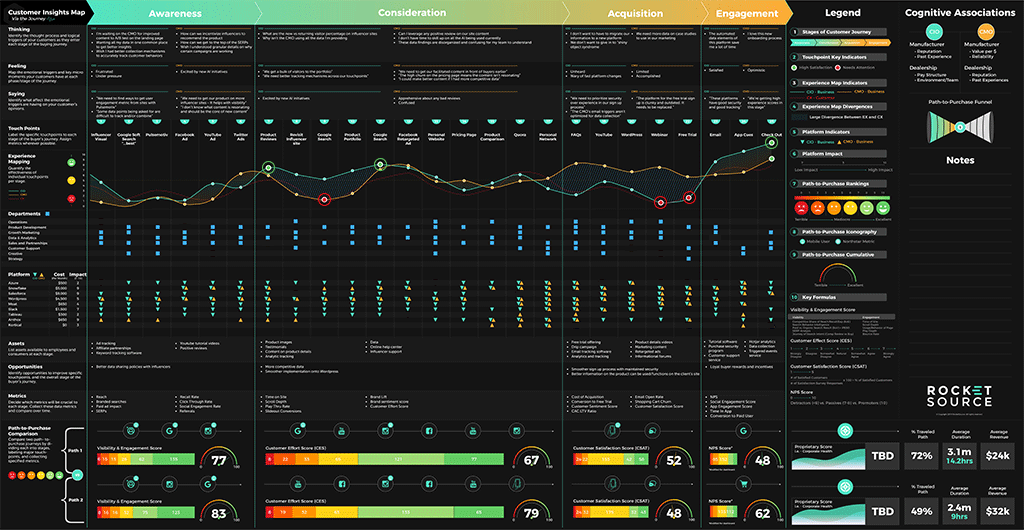
A map like this provides a foundation for quickly analyzing the potential for cost reduction and revenue growth side by side. Specifically, this example showcases two critical components to more intelligent decision-making:
- The highest performing path based on cost of acquisition (CAC) and LTV:CAC ratio
- The highest performing path based on customer experience score
CAC is a big deal in today’s climate — bigger than ever before, according to Mary Meeker’s 2019 Internet Trends Report (arguably one of the best reports out there). Meeker’s research shows an increasingly competitive market. This steep competition is ratcheting up the average cost of acquiring new customers. In 2017, the average CAC was less than $30. Today it’s around $45.
Comparing path-to-purchase analytics on a customer journey map addresses this rising trend of high CAC costs. It lets us hone in on the path with the lowest CAC and best LTV:CAC ratio. This level of analysis is a huge differentiator between a ‘good’ company and a leading company.
Only 23% of all companies said they could effectively measure the impact of analytics on the key performance indicators of the business, while 63% of leading companies said they could. – Harvard Business Review
Companies empowered by this deeper level of analysis can quickly see which initiatives are working and which are not, both from a cost and revenue standpoint, and from experience level. In doing so, they’re able to adjust course and make smarter decisions on how to spend, thereby spurring on faster growth. With the surge of artificial intelligence and machine learning opportunities, the need to operate intelligently on agile to remain competitive is only gaining speed.
Speeding Up Path-to-Purchase Analysis Using Machine Learning and Artificial Intelligence
Our clients love the insights afforded by our version of the customer journey map — so much so that many of them request a digital version of it for their organization. Specifically, they want the ability to analyze various paths-to-purchase and paths-to-loyalty as a way to optimize their own CAC, LTV:CAC ratios, and other North Star metrics in a homogenized fashion. To satisfy these requests, we’re actively developing models (and approaches to modeling) to provide in-depth, real-time analytics alongside the customer journey map we’ve built.
This development is not as simple as it might seem. As much as everyone’s talking about modern technologies, very few organizations have successfully reshaped their business with artificial intelligence, let alone know how to apply it to customer journey analytics. While 75% of executives believe artificial intelligence will enable their companies to move into new markets and 85% believe artificial intelligence will beef up their competitive advantage, only one in twenty companies has incorporated these processes. Fewer than 39% of companies have an artificial intelligence strategy in place. MIT’s research shows that smaller companies are the most likely to strategize about how to use artificial intelligence to leverage their customer journey analytics.
There isn’t a straight-line approach to creating algorithms which can analyze something as complex and nuanced as human behavior and organizational growth via business transformation.
For any experienced data scientist, the idea of taking analytics from a single touchpoint and parsing it back into data nodes before eventually moving them into something like a customer journey map is simple enough. The true power of this type of analysis is in delving into the decision science behind journey analytics, even in a basic manner (assuming you’ve taken the proper steps to understand how to pose the question in a business-appropriate manner at both macro- and micro-levels, or touchpoints). A few examples of these questions include:
- To what extent do we care about the propensity of a given lead to convert (precision vs. recall)?
- How much time will it take the lead to convert?
- Do we care about the likely deal size that will result from a conversion instead?
- How do we define the lifetime value of the customer?
- How do we define a canceled customer?
- How do we approach the model (supervised, unsupervised, reinforced)?
- For what type of problem are we solving for (continuous numerical, classification, input groups, anomaly detection)?
- Which algorithm(s) should we use (Random Forest, K-Nearest Neighbors, Gradient Boosting, Neural Network, etc.)?
All models come with unique, nuanced preparation and execution protocols. Preparatory measures must be taken and must include individuals who can compose the data accordingly, as well as the appropriate stakeholders who are intimately familiar with consumers’ journeys with the brand. Once modeling has begun, data scientists can take these and other analytics at each touchpoint and then stretch them across the entire journey. The results, when approached methodically within a framework and executed with a consistent level of forethought and rigor, are flat-out substantial. It’s here you’re able to get a beautiful, insights-driven picture which articulates what the buyer’s experience is actually like. Google seems to agree that businesses need to rethink the customer journey, saying that no two customer journeys are alike. Here’s why.
Each business’s Customer Insights Map will take a different shape depending on the organization’s goals and its North Star metric. Some businesses want to make more money, while others aim to lower costs, shorten the purchase time, improve CSAT or employee experience, etc.. These shifts in goals, as well as the market’s ever-changing needs, make it difficult to standardize this level of analysis across the board. But, when you can pull out predictive insights and disseminate them across the organization, the results are powerful.
Layering data on top of a customer journey map lets you drive the story and ultimately gain buy-in.
You’re able to take beautiful eye candy, in the form of a customer journey map, and back it with data. It’s that one-two punch which will earn you the ear of the C-suite. For marketers, product managers, and creatives, this need for visualizations backed with data means you need to know how to speak the language of data science. For data scientists, it means you must talk the talk of the departments you’re working with. A Customer Insights Map helps businesses shake off thinking in touchpoint specifics and start looking at journeys with a more holistic, yet detailed approach.
Leveraging Sophisticated Technology for Powerful Insights
Although machine learning might seem daunting to some, trust us when we say that it’s possible, but getting started requires that you understand how some of the most sophisticated technologies in the world can be pulled together to work in harmony with one another.
A recent Forbes article compared three core technologies used to develop artificial intelligence — data-driven, algorithm-driven, and process-driven. For now, most artificial intelligence is data-based, which is an approach that might not be effective as more organizations leverage sophisticated technology to fuel their understanding of what’s happening along the buyer’s journey. While data, algorithms, and processes each have their benefits, the article concludes (and I agree) that you need all three to succeed. I argue that there’s a fourth necessary component as well — humanization.
No matter how complex these technologies become, the need for humanization will never go away. It’s why companies, like IBM with Watson, are taking the bull by the horns and simplifying what’s possible with these technologies. Tomorrow’s leaders are those businesses which will learn about their customers’ journey progressively as buyers are experiencing it, not after they’ve lost a bundle of sales.
The potential of machine learning and artificial intelligence is exciting to us at RocketSource. One internal source of influence is Paul Mizner, an Amazon innovator who uses machine learning at home. He’s one of the forward-thinkers who inspired us to start playing around with our algorithms, and we’re glad we did.
Today, we’re working with several Software as a Service (SaaS) solution providers (e.g., Domo) to reduce attrition in their accounts by bringing our knowledge to bear in their businesses. Like Paul, we’ve seen and done loads of our own AI experimentation simply because we have a pure passion for this technology. One person in particular on our team who has spent hours, days, and weeks playing with algorithms is our Vice President of Data Science, Cassidy Hilton.
In the following screencast, Cassidy leverages Uber Engineering’s recently dropped Deep Learning toolkit, Ludwig, from lead engineer, Piero Molino. To say we’re impressed with the toolkit is an understatement. Cassidy has asserted for years that it’s not algorithms or technology which move the needle for organizations — it’s the agile approach and frameworks of which the technology is a component that bring real value and meaningful results. Right out of the box, Ludwig allows for this approach because the toolkit doesn’t require onesy-twosy fitting and tweaking, but does support adding more specificity to your modes. In this screencast, Cassidy walks you through a lead conversion model that initially focuses on Facebook data, but expands to incorporate additional context from Google Analytics and sentiment data.
Click play to hear our Vice President of Data Science speak about what you’ll see in the screencast below in more detail.
This screencast offers a great primer for using machine learning and predictive analytics. As you watch this, keep in mind that you’re seeing an intentionally oversimplified look at what goes into creating any model like this. I asked Cassidy to make it super-digestible so you can begin to understand how you might build an engine in and around the Customer Insights Map. With a few basic unpacking skills, a V-Shaped team member can watch this screencast and pull out the arrays, pivots, and more from qualitative data, such as sentiment text.
We chose sentiment text to focus on in this particular model because it can take all forms and shapes across the web. Sentiment mining tools like Repustate, Brandwatch, Clarabridge and dozens of others provide tremendous insights into what’s being said in today’s digital ecosystem. The more context we can add to these insights, the more we’re able to uncover powerful opportunities for innovation to the digital experience.
After we run this data through a machine learning primer application such as the one Cassidy created, we can then start plotting it out, visualizing it, and disseminating the knowledge gleaned from it. Remember, the goal is to simplify seemingly complicated and unmanageable data sets by making the concepts quick to comprehend via machine learning. When the crosshairs start to come into focus, the results bring massive amounts of value. It’s through this convergence that you can then simplify the data even further and put it on a sentiment dashboard like this one.
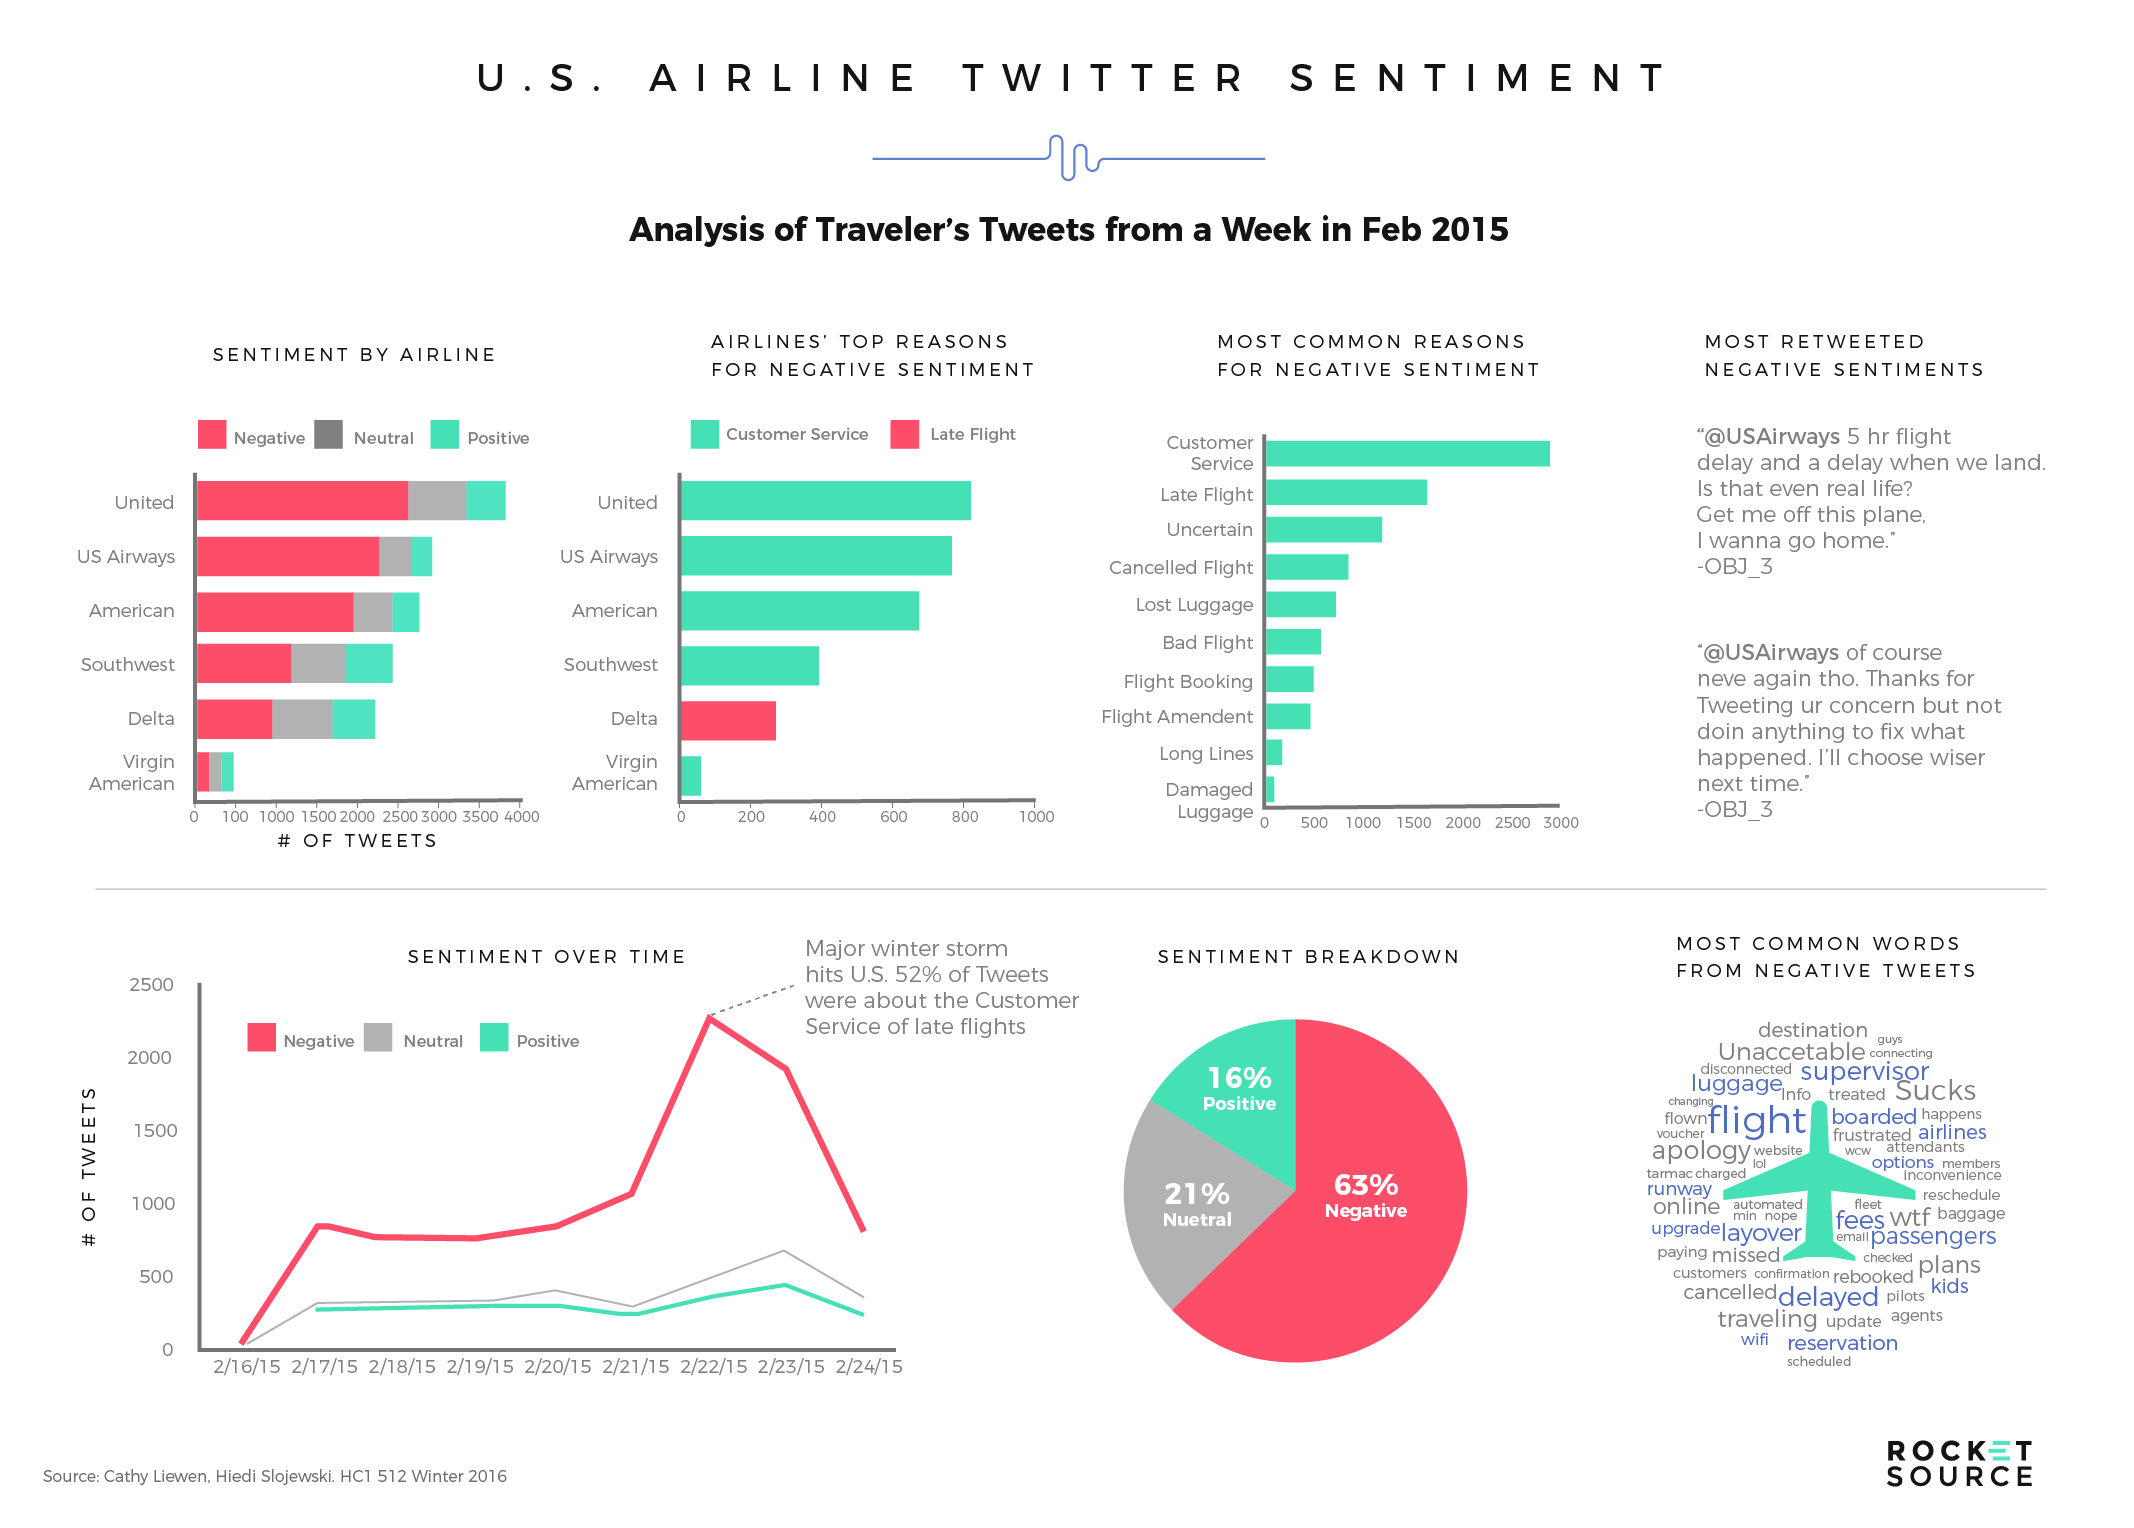
This dashboard makes it easy to see how the captured data impacts the market’s view of the brand. We’ve now whittled down all of that complex data and turned it into something, which can tell a story to everyone in the organization, regardless of background or job role. It’s through these types of dashboards that teams are better able to identify patterns and put their heads together to brainstorm ideas for growth generation.
As more companies build artificial intelligence and deep learning models for customer experience automation, brands which don’t leverage these technologies will lack the critical insights they provide and will consequently fall behind their competition. Can you see why machine learning and artificial intelligence are so essential in increasing customer LTV by reducing attrition? And can you see why the data visualization of a Customer Insights Map is so critical to ensure that the strategies, analytics loops and models built and deployed are working internally and externally?
I mentioned that Cassidy leveraged a toolkit from Uber’s engineering team. Uber’s had plenty of other successes in tapping into tools, like the one showcased by Cassidy, to actively develop and improve artificial intelligence driven by customer engagement. Take a look at an Uber Eats email campaign launched in 2017 that is still used today.
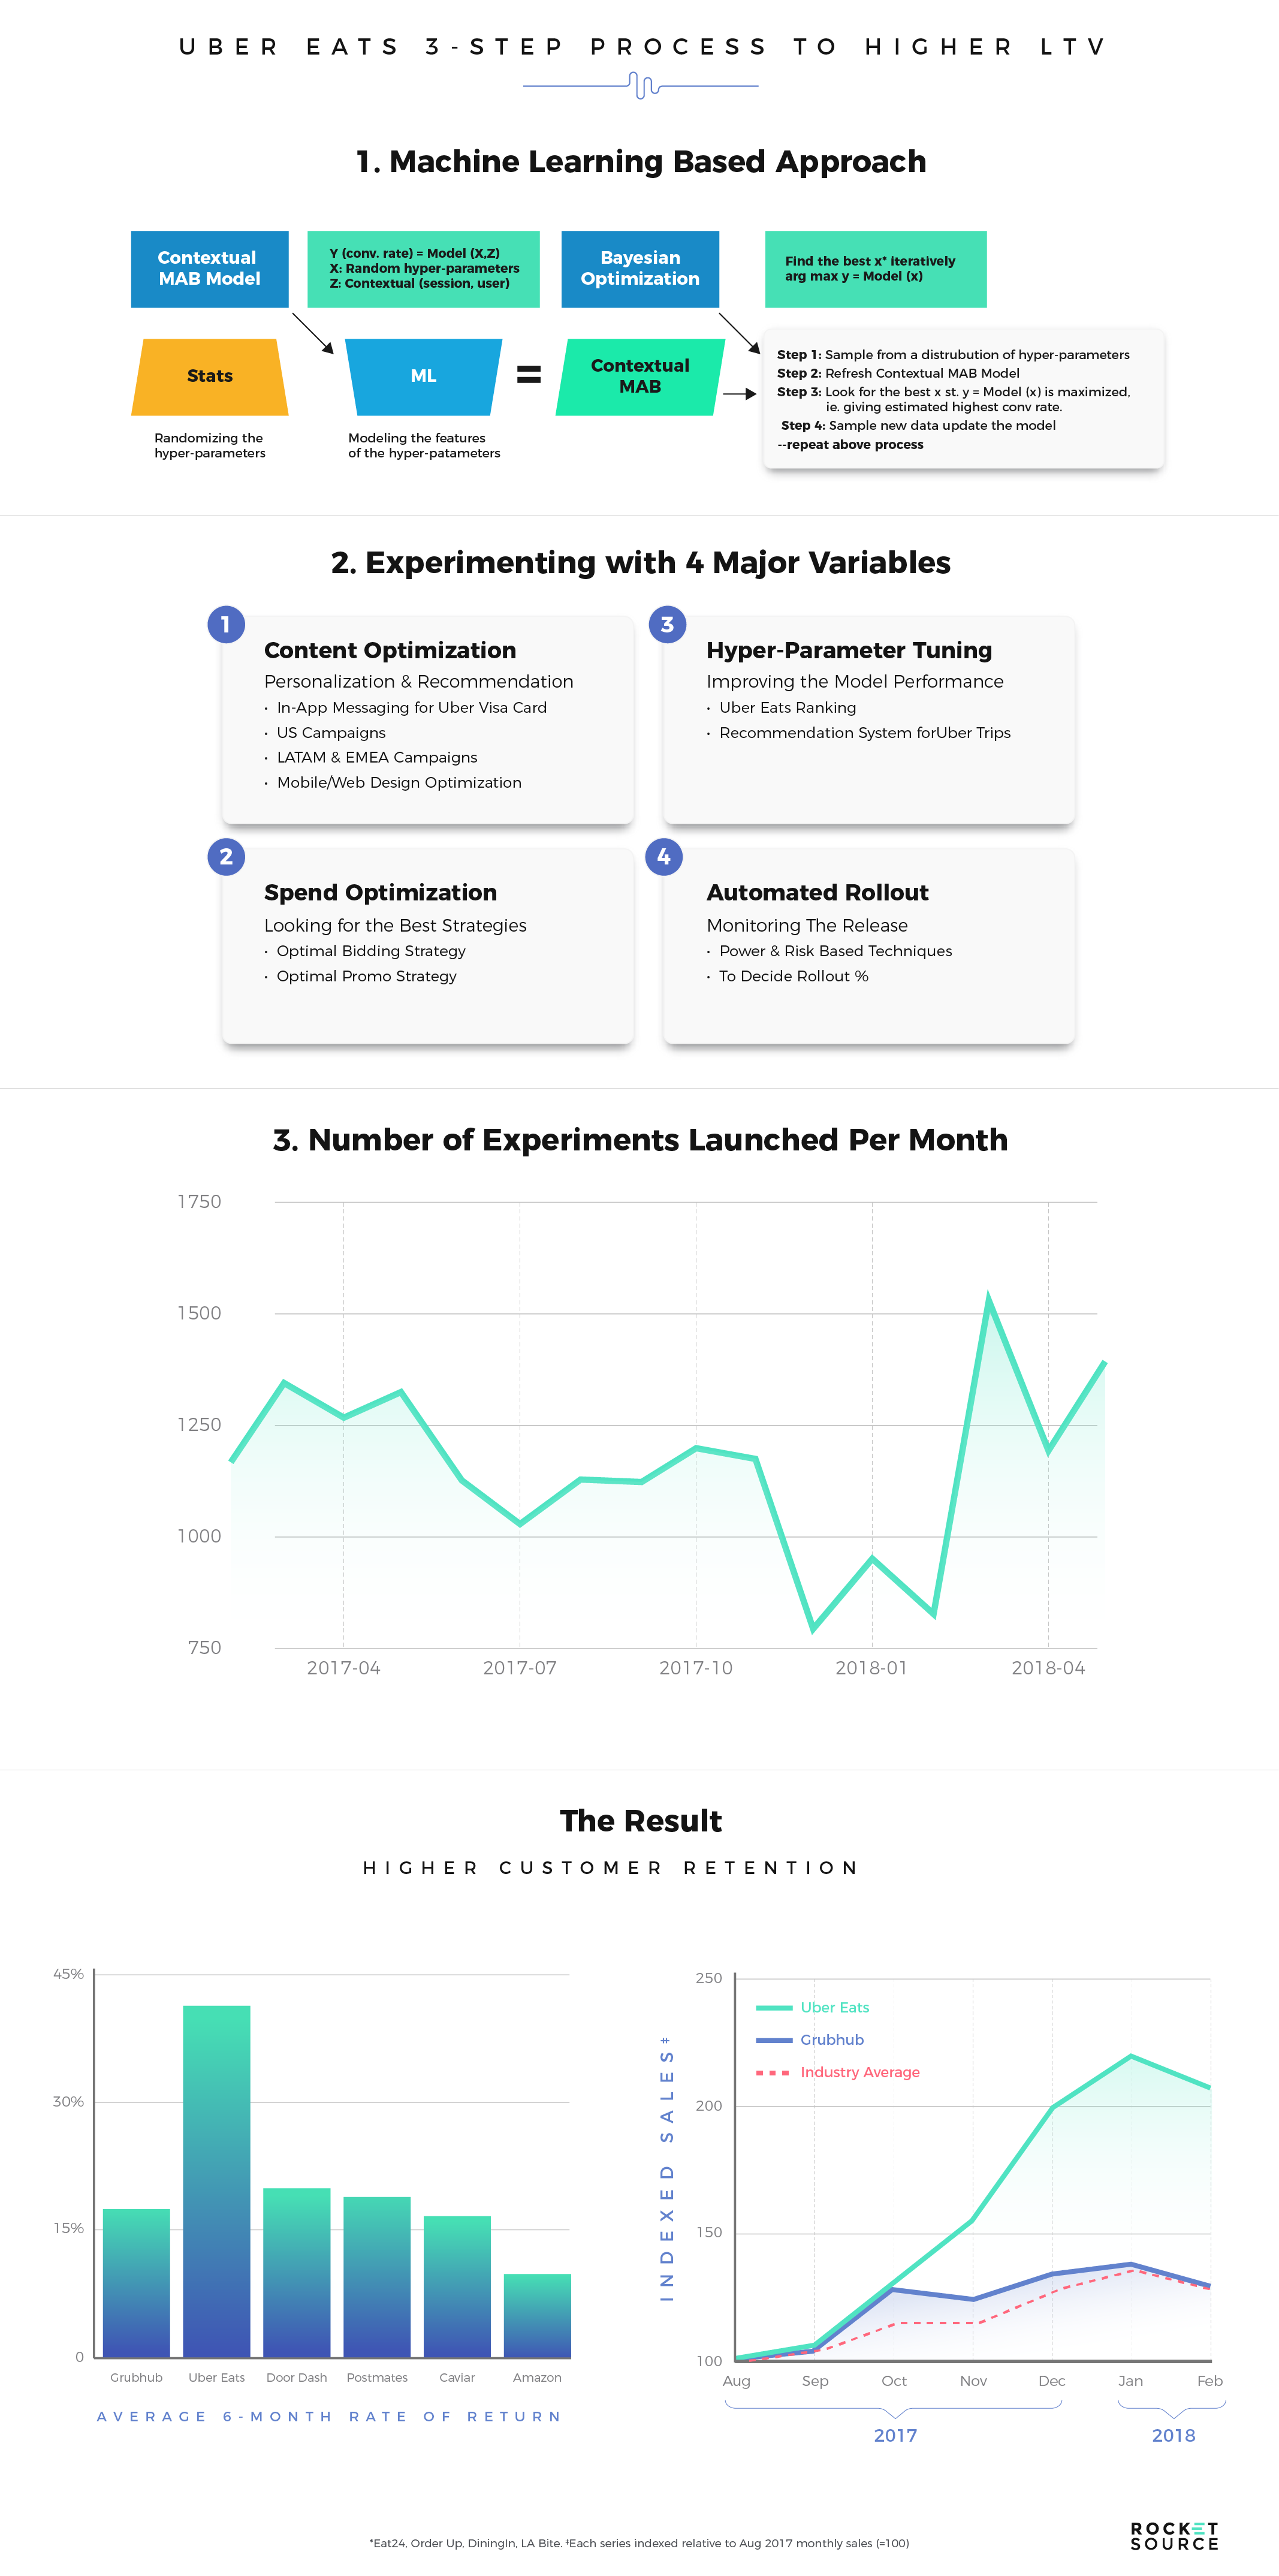
When this program first launched, Uber wanted to know, “What strategy works best for getting new eaters?” The company was already working hard to deploy marketing campaigns across a variety of channels and touchpoints. For example, target cohorts received email promotions, which drove consumers to download the app and try the service. The company then closely tracked conversion rates within the app. After running numerous tests, data scientists took the data and mapped it back to the most profitable paths-to-purchase.
The Uber Eats team put together a machine learning model to run continuous experiments, empowering their teams to make faster decisions based on real-time data. They ran a variety of statistical methodologies and analytics to compare consumer behaviors across various paths-to-purchase. The findings were surprising:
The channels driving the highest conversions yielded the customers with the lowest lifetime value.
Customers would convert to get an attractive discounted offer but then not return. Instead of continuing to focus on attracting consumers, Uber Eats chose to focus on retention by targeting the cohorts with the higher lifetime value. They shifted gears, pushed promotions to the side, and focused on a four-pronged approach — content optimization with more personalization, hyper-parameter tuning to increase the effectiveness of their model, spend optimization to uncover the most profitable strategies, and an automated rollout to lower risk as they went to market with new ideas.
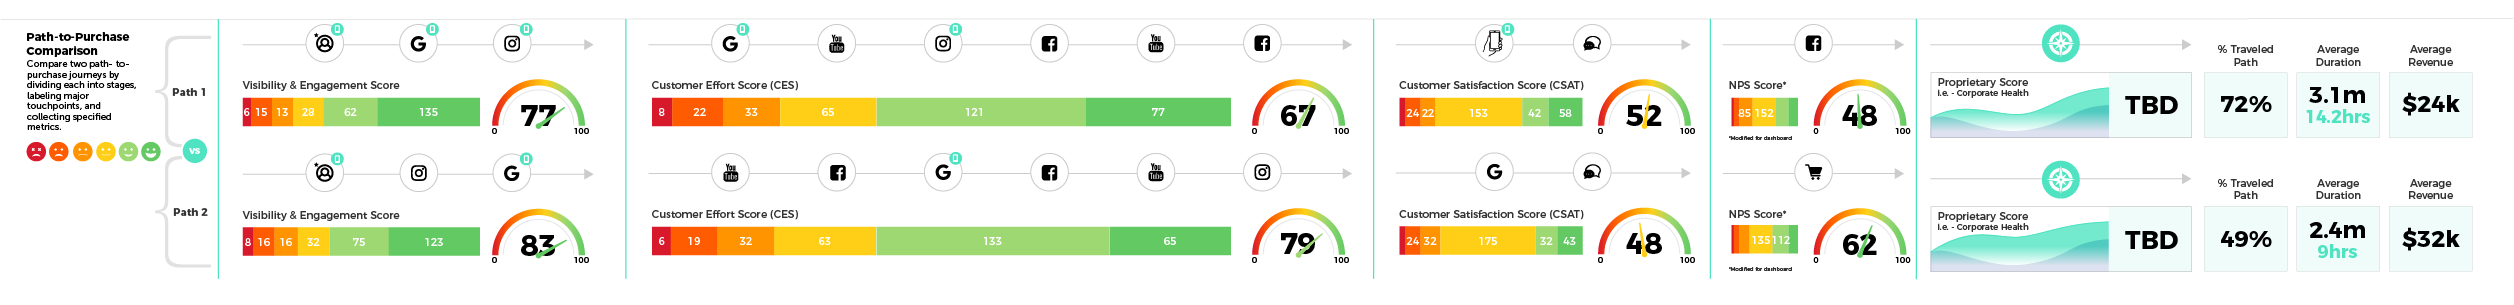
Had they stuck to looking at one-off initiative successes, they could’ve left a lot of money on the table. The company continues to experiment with various paths-to-purchase today to fine-tune its approach and drive the biggest growth. This process has been integral in turning Uber Eats into a billion-dollar company on track to deliver $4 billion more worth of food in 2019 than in 2018, which will yield $1 billion more in revenues and put them ahead of their rivals Grubhub, Caviar, Postmates, and DoorDash.
Monitoring path-to-purchase analytics isn’t a one-off initiative. It requires continual real-time analysis of how consumers are engaging with a brand and which channels are prompting them to take action. But it goes deeper than looking only at channels. You must look holistically to understand which channels a buyer must progress through to bring in the most profits for the organization. Senior Data Scientist at Uber, Jeremy Wenxiao Gu, said:
“What we learned was that patterns change over time and that predicting the future is hard.”
Predictive analytics are excellent but they’re challenging, especially in today’s fast-paced ecosystem. The best approach we have today to quickly see and react to a constantly changing landscape is to continually monitor what’s happening along the path-to-purchase and take a dynamic stance, adjusting strategies and messaging to match what the consumer needs. This approach requires you have a Customer Insights Map at the foundation.
Fueling Digital Transformation Via the Customer Journey Map
As you start to gather data within your organization, you’ll be faced with a choice — what do you do with the insights you uncover? How will you bake those insights into your product iterations and experience layers to put what you’ve learned to work? More importantly, how will you ensure everyone across the organization, regardless of department, is leveraging the same insights and continuing to work in harmony, without silos?
Silo walls are a tremendous hurdle for organizations today. Research shows that ineffective organizational structures obstruct digital transformation efforts, and data isn’t helping cure that roadblock. The more data we get, the higher these silo walls rise. In a recent IDG report, respondents said that tech silos were one of the top roadblocks to transformation of their IT infrastructure.
There are tremendous challenges for companies today regarding how we meet IT goals and objectives. When silo walls stand in the way of answering those challenges, everyone loses. A lack of organizational alignment, data governance, skill sets, and architecture poses real hurdles companies will need to jump over as technology evolves. Many organizations may benefit from a customer journey map as a starting point to improve communications and get teams on the same page, effectively tearing down silo walls.
One of the reasons our version of the customer journey map is requested so often is that, unlike many other maps, it’s not geared toward marketing alone. Our version goes well beyond a singular department and spreads across the organization to data science, data architecture, HR, finance, you name it. With insights democratized for the entire organization to readily consume them, you’re empowered to create more intelligent experiences.
Making this asset accessible to all departments can guide initiatives from how DevOps rolls out product iterations to how human resources reaches and retains top talent. The real-time analytics showcasing what’s happening along the most lucrative paths-to-purchase can be leveraged to hone in on the experiences consumers demand. However, to gather these results requires you to have the right digital ecosystem and development platform in place first. That ecosystem starts with your digital twin.
The Digital Twin Meets Your Customer Journey Map
It’s safe to say the missions run by NASA don’t leave a lot of margin for error. When lives are on the line in space, engineers need the expertise to analyze how well each machine is functioning and predict when it might break down. To do that, NASA developed something called a Digital Twin — a full-scale digital version of a real-world object and/or process, which can be used to make a virtual replication of what’s happening in the physical world. This technology was used to rescue the Apollo 13 astronauts and now, decades later, it’s being used by organizations to better understand the performance of their people, processes, and platforms.
If you’re not familiar with this concept, take three minutes to watch this simple yet detailed video about how digital twins are helping organizations today.
Introduction to Digital Twin: Simple, but detailed
Building a digital twin is one of the first steps an organization must take to kickstart digital transformation. The analytics derived from a digital twin are high-quality, real-time, and predictive in nature, helping keep organizations on track during digital transformation and throughout strategic shifts.
Considering the power behind this one concept, it’s clear why Gartner named digital twins as the Top 10 Strategic Technology in 2017. However, many companies haven’t created one or figured out how to leverage this concept for their transformation efforts. One way we’re helping our consultative clients with this right now is by working with the CIO and CTOs to create this digital twin using a data warehouse called Snowflake.
Snowflake is a cloud-based data warehouse which helps data scientists and those tasked with reporting data make sense of everything coming into the organization. The type of warehouse used is vital because an outdated or encumbered system will make it significantly harder for teams to scale and grow as fast as the market demands. When data is not as readily accessible, everything runs like molasses.
The virtual version of your business is an essential part of a core strategy. As your digital twin is fed information and data in real-time from the physical world, it’s able to analyze those insights, run predictive models and feed you opportunities to optimize your current transformation initiatives. Having a digital twin in your back pocket helps you align your organization’s “why” as closely as possible with your customer’s emotional and logical triggers. It helps you quickly find specific areas where you can improve to optimize your employee and customer experience better. In doing so, you’re better equipped to reach the highly coveted spot of brand euphoria.
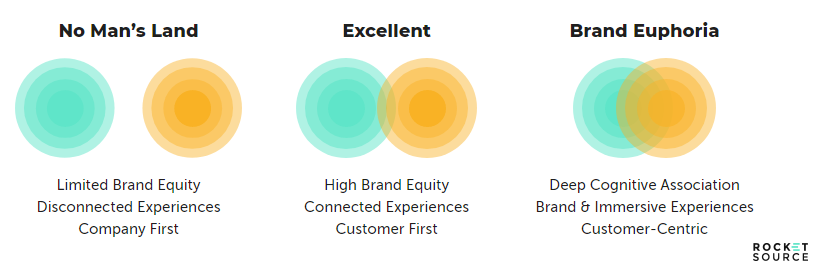
Traditionally, customer journey maps have been a one-off exercise. With a Customer Insights Map, you have a digital twin loop which allows you to infuse data into the customer’s journey and path-to-purchase and gain a more dynamic view of what’s happening along the customer’s journey. It’s a virtual replica of what’s happening in the physical world, which can empower you to better predict when to transform and what that transformation must look like for it to be a success.
Take a look at WeChat as evidence of an organization which has embraced the insights available via a digital twin to basically kick everyone’s ass in the social world. If you’ve never heard of WeChat, just take a look at some of their impressive successes.
WeChat isn’t just another social network. It’s an app designed to do just about everything — messaging, social networking, and e-commerce are only the top three functions. App users can also hold a video call, hail a cab, or collaborate with coworkers. The app launched in 2011, and by 2018 had reached over 1 billion monthly active users. That growth is expected to continue in China, where the app was developed, building from 76% penetration to over 90% penetration by 2021.
The secret behind WeChat’s success wasn’t the rapid development (although that certainly helped). It was taking a strategic direction and delivering what the modern consumer wanted by leveraging data to find a wide range of opportunities.
Their e-commerce platform is a prime example of this growth. Consumers can find just about anything their little hearts desire to buy within the WeChat app. The developers knew this was an essential feature because they understood their buyer’s behavior. Generation Z skips the stores and shops online — particularly in China. WeChat knew they needed to pay attention to Generation Z’s purchase behavior because this generation wields the most influence over how their households buy goods.
It’s not just that Generation Z prefers the convenience of shopping online. They make buying decisions after getting suggestions from social media influencers, known in China as wanghong. These influencers also live within the WeChat app, so consumers get everything they need in one convenient place — the recommendations they rely on and the ability to buy. The most disruptive companies have recognized these new consumer behaviors and are now embracing the new norm by selling products in the WeChat app. By 2022, it’s expected that $413 million will be sold through social e-commerce, and WeChat will capture a large percentage of those sales.
Behavioral changes from one generation to the next happen almost overnight. Without having a digital twin to compare your business model to what’s happening in the physical world, it’s harder to capture these shifts in real-time. The slower you are to transform alongside market demands, the further behind you’ll fall to competition which is adapting to using the technology available today.
However, it’s not enough to know that changes are happening. You must also be able to react quickly and efficiently. To make swift transformative changes requires you to build your products and utilize platforms, such as microservices and event-driven architecture, to operate more on agile.
Microservices and Event-Driven Architecture
A few years ago, when RocketSource first started, I told my co-founders Jonathan Greene and Steven Kiger that Mulesoft would be acquired within two years. Mulesoft is a platform which connects SaaS and enterprise applications critical to catalyzing digital transformation via microservices. In 2018, a few months after that conversation, I read in my Apple Newsfeed that Salesforce acquired Mulesoft for $6.5 billion, making it the biggest acquisition in the company’s history. Why was that purchase so significant? Because Mulesoft and other similar platforms are solving a critical problem — the ability to make tweaks to your offering without uprooting and destroying the entire system.
Microservices break up the traditional structure of applications, decentralizing it and allowing various components to be developed and maintained independently. This approach happens via a container orchestration system known as Kubernetes. If you’ve never heard of Kubernetes or aren’t familiar with it, take five minutes (yes, only five minutes) to watch this video.
Kubernetes in 5 minutes
While it might be hard to illustrate all the depth and nuances of Kubernetes in five minutes or less, this video gives you a broad overview of it’s importance in today’s world. As Red Hatter Jamie Duncan said:
Containers are revolutionizing the data center and how we think about technology. They’re making us rethink how we approach the delivery of software, and thus, the customer’s experience.
As you connect various containers, you’re able to orchestrate and maneuver them to work in new ways. Often those new ways allow you to create more innovative experiences and adapt to the changing consumer landscape.
Connecting new systems via microservices empowers you to stay agile, get to market faster, and, ultimately, stay relevant.
However, staying agile for the sake of moving quickly doesn’t do any good. It’s strategic movements and adjustments to your platform that drive true transformation. By mapping the customer’s journey as you undergo digital transformation initiatives, you’ll constantly gain insights from your data on your customer journey map and identify opportunities to optimize your offering for the current market. When those insights and opportunities arise, you need to make swift changes. If you rely on the strategy of throwing out legacy systems and building new systems from scratch, you’ll never be able to compete in a fast-paced market.
But it’s not just regular and swift updates that improve the customer’s experience. It’s also how programs are architected to meet the consumer at their stage of the journey. Applications often touch customers at numerous points within their journey, spanning multiple services. Answering every stage of their journey with one product requires that you have mechanisms in place to deliver a consistent, personalized experience no matter which stage they’re in. One way to achieve this consistency and setup is through event-driven architecture. Here’s how Tech Target defines it:
An event-driven architecture (EDA) is a framework that orchestrates behavior around the production, detection and consumption of events as well as the responses they evoke. An event is any identifiable occurrence that has significance for system hardware or software.
The way you architect your customer’s experience must be agile enough to evolve alongside their journey with your brand. For example, in the beginning, a person who is unfamiliar with your platform will need onboarding guidance, which you might deliver via an experience layer with AppCues or a conversational guidance mechanism with Pulsemotiv. As the person adopts your product and usage of your platform becomes ingrained in their daily life, they won’t need the same handholding they did in the beginning. Event-driven architecture can adopt the messaging delivered within the program based on product usage, providing a more personalized experience automatically.
Organizations build out event-driven architecture based on findings within the Customer Insights Map. Pairing that journey with what you learn from your path-to-purchase analytics and on your customer journey map, you’re able to quickly target the paths and build out the experiences that drive the highest LTV:CAC ratio.
One brand which has successfully increased LTV via event-driven architecture is Spotify. In Mary Meeker’s 2019 Internet Trends report (citing it here again because it’s such a good one), her team determined that Spotify’s freemium model drives approximately 60% of their premium subscribers, while their ad-supported music streaming service is only there to offset the cost of new subscriber acquisition. This strategy of offering a better user experience increased Spotify’s LTV:CAC estimate from 1.5x in 2015 to 3.0x in 2018.
Today, Spotify has over 100 million users and paid subscribers — a 32% increase in paid subscribers in just one year. One of the ways they’ve achieved these impressive results is through event-driven architecture. Here’s a sample of what that structure looks like.
Spotify’s event delivery via the cloud is no small feat. There are over 300 different types of events generated from Spotify clients and exported by cloud pub and sub-streams to cloud storage. These events include who has listened to a song, skipped a song, shared a playlist, or just opened the Spotify app. Based on the findings of these events, Spotify can tweak how they deliver music recommendations, analyze client crashes, and more.
Spotify knows the value of these events and has invested heavily in delivering and processing them as a means of testing updates and tweaks and then rolling out the best end experience for their consumers. By adopting their service to their customer’s needs across the entire journey, Spotify has become a leader in the music streaming space.
Event-driven architecture is a clear winner because it allows organizations to personalize the experience automatically for their end consumers. By monitoring usage and tracking events, companies can stay relevant to their users regardless of where they are in their journey.
How We’re Walking the Walk Using Next Level Customer Journey Mapping
I’ve made a lot of claims within this post about the power of intelligent Customer Journey Mapping because I’ve seen it work for so many companies, RocketSource included. It’s so potent that we’re using it ourselves to develop new products and grow. Specifically, within our Labs division, we’re solving some of the biggest problems which exist today — and we’re doing so via a customer-centric approach. Every day we use the StoryVesting framework, advanced protocols, data loops, and more to develop answers to modern consumer challenges.
Case in point: in conjunction with some of our biggest clients, we’re working on a solution to help solve the problem of scattered digital content (both personal and professional). We didn’t just stumble upon this problem. We uncovered it after doing a healthy amount of research. What we found was that just about everyone — regardless of background, profession, or generation — is moving their lives to the cloud. This tremendous shift to a digital world happened quickly. Today, juggling scattered content across multiple platforms has become the norm.
In our offline lives, organization has become a hot topic. Look at Marie Kondo’s number one Netflix show “Tidying Up” as evidence. Within a month of airing the first season, Kondo’s anti-clutter crusade was deemed partially responsible for a 10-20% increase in donations to Goodwill. While Kondo was solving the problem of physical clutter, people were crying out for her to take her approach to the digital world.
These tweets are only a small glimpse into the iceberg of a problem digital clutter has become. In today’s world, where more is getting moved to the cloud and we’re inundated with content, it’s not easy to find what we need. It’s even more challenging to find quality among all the spun stories and fake news. We’re so buried that finding websites, articles, or videos from a day or two ago is a headache-inducing chore.
It’s easy to see how quickly digital clutter has taken over our world when you look at how our technology usage has evolved over the past few decades. Moses Kim showcased this image in his post about UI and UX design trends.
As consumers move to an increasingly complex space, it’s becoming more difficult for developers to keep up with the demand for a universal solution to organize it all. The fact is, there just isn’t a tool out there to answer this challenge, so at Labs, we’re creating one.
Cleaning up the digital ecosystem is not an easy problem to tackle, but we’re so committed to answering this call that we’re all making a massive sacrifice here at RocketSource — much like I made back when I was a part of the iBahn Sexy Six — not only on the partner level but for everyone in the RocketSource family. We’re doing so gladly because we’re all vested in solving a major pain point for the market.
Although we can’t tell you what the product is quite yet, we can lift the veil on our strategic development process, which encompasses the core teachings at RocketSource — people, processes, platforms, the StoryVesting framework, the Customer Insights Map powered by Empathy Mapping, and our modified Hoshin process methodology.
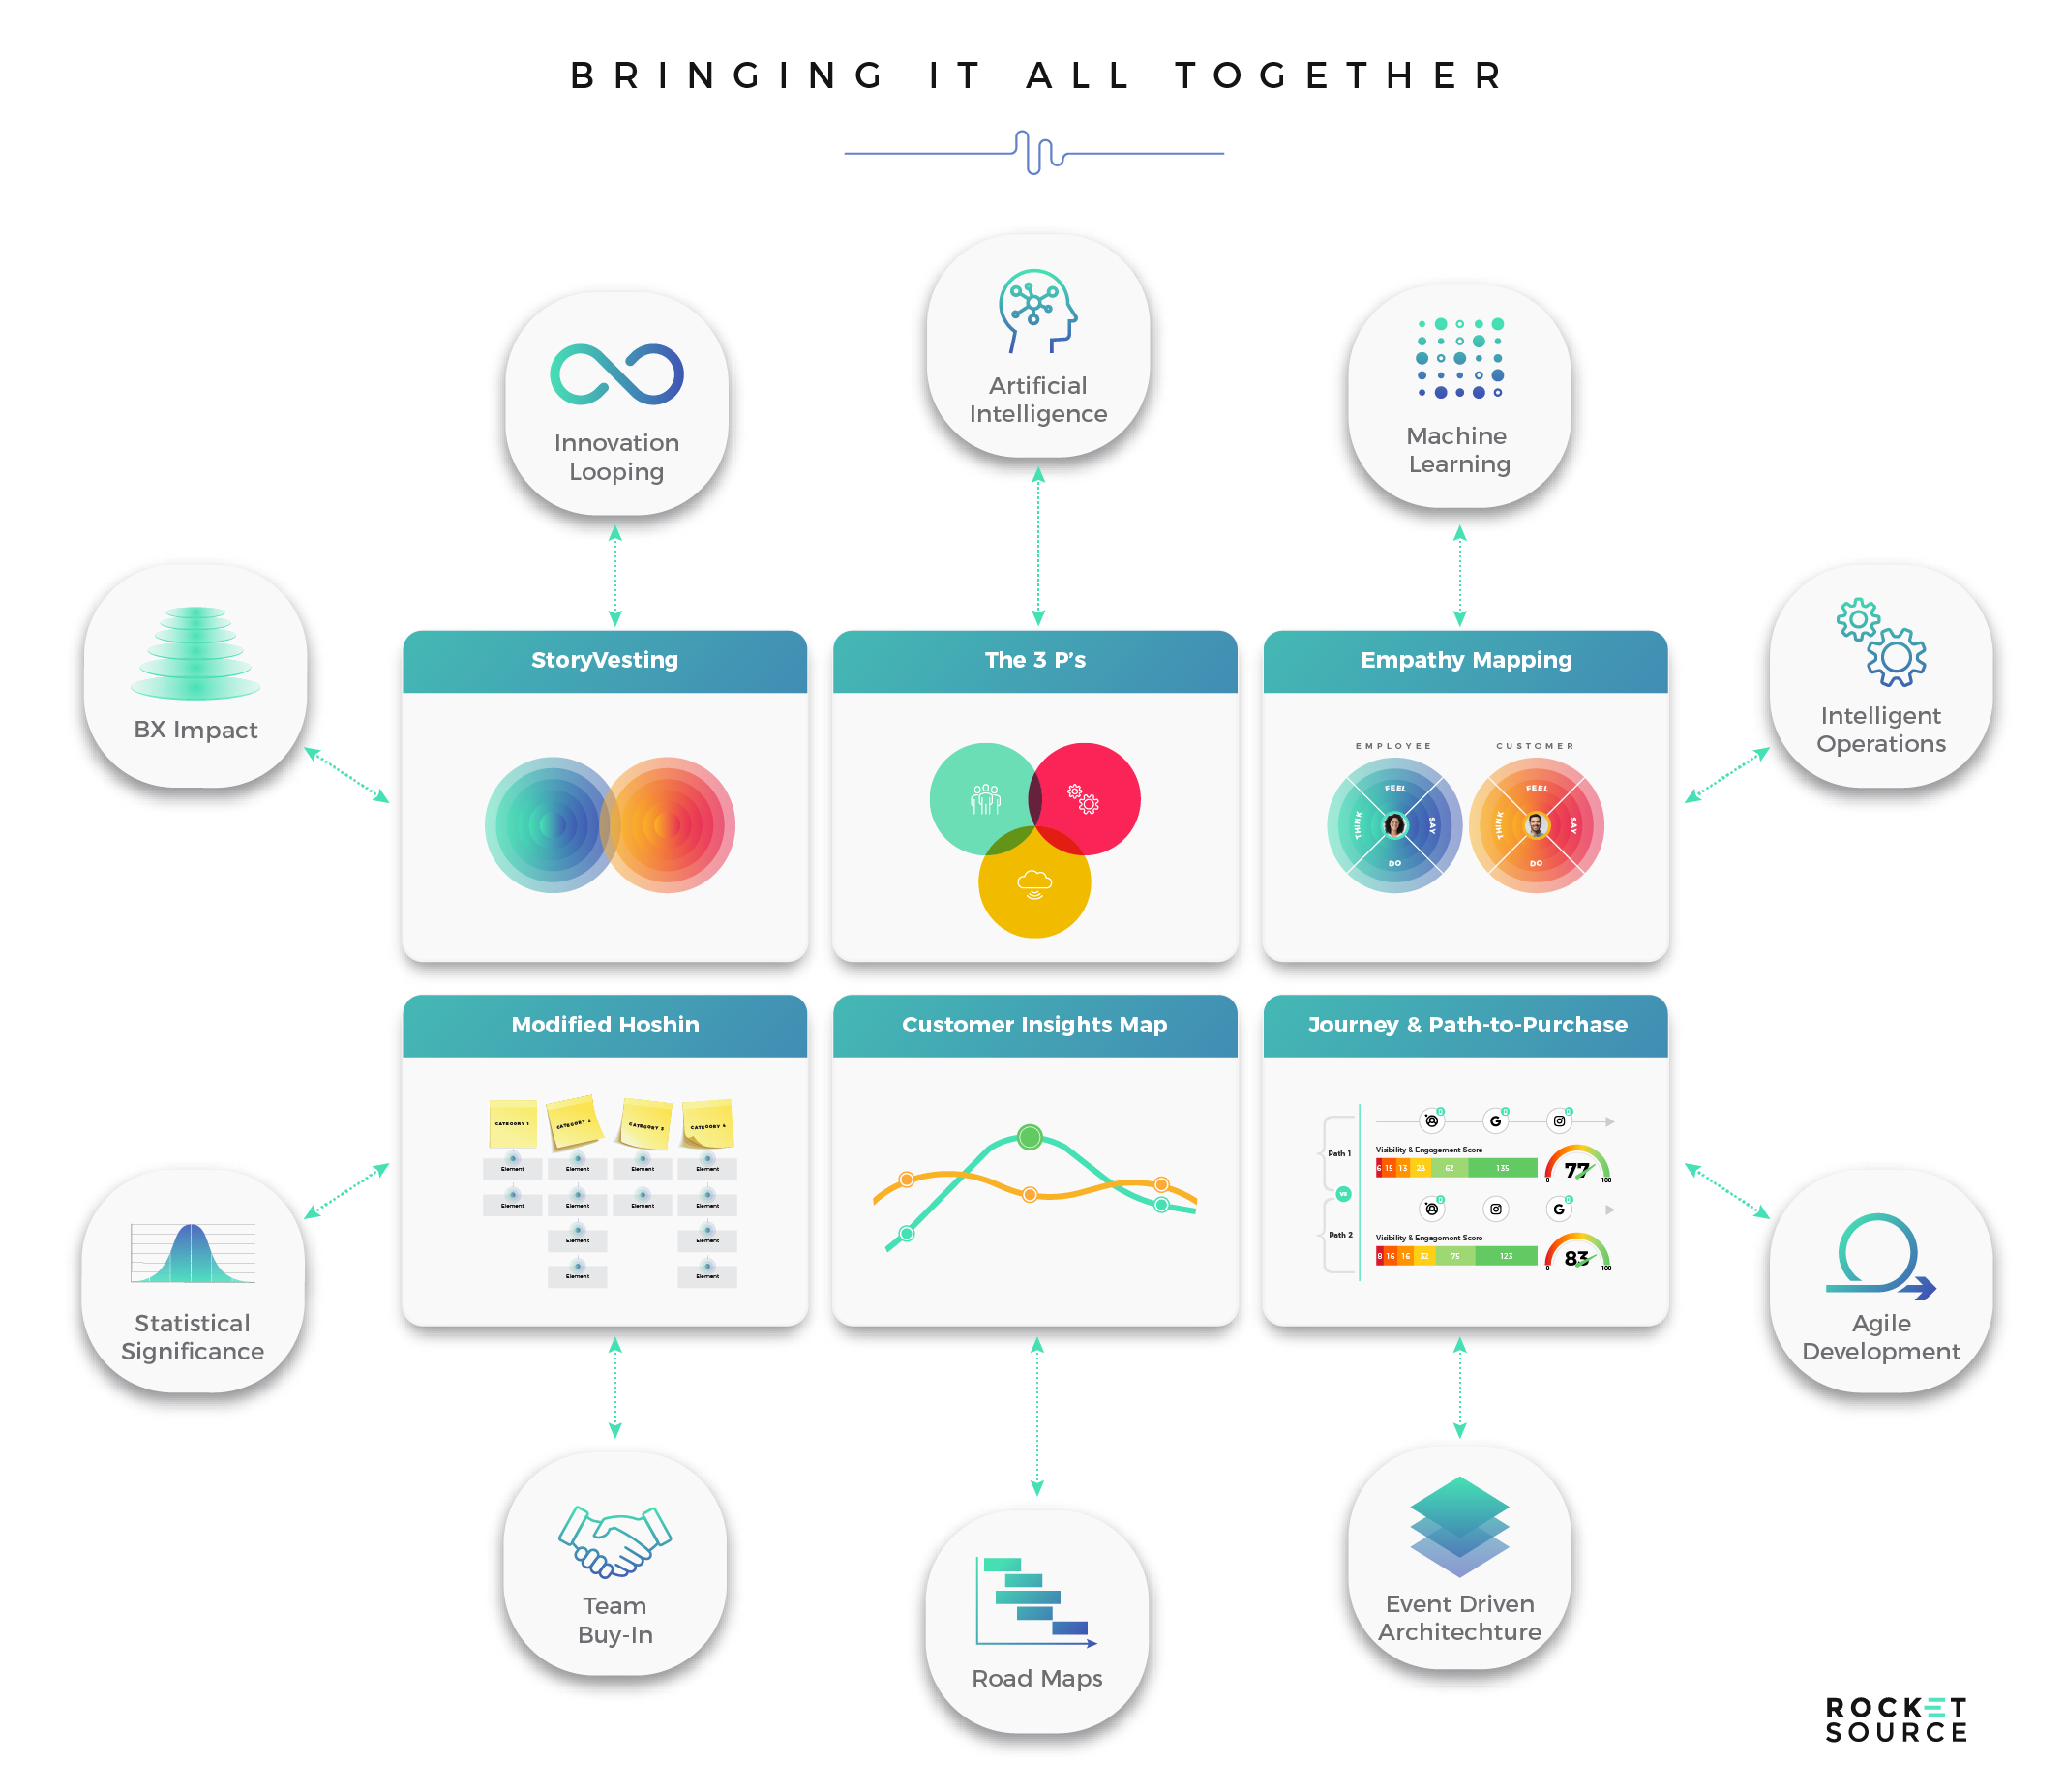
The first step in building out our product wasn’t to sit around a conference room table and spitball ideas. Instead, we went out and talked to the market. We watched how people use the Internet, and when we saw an abundance of browser tabs open on just about every computer we leaned over, we knew something had to be done to remedy the problem. Once we had the qualitative data we needed, we used all the tools we teach in LevelNext to plot the users’ wants to a wonderful UX/UI experience, starting from a cognitive and behavioral perspective.
It didn’t take long before we spotted some clear disconnects, or divergences, which we were then able to reverse engineer into a product. We’ve taken these gaps in what’s out there versus what the user wants from the digital experience and used them to inform the architecture and features of a product we’re building behind-the-scenes.
We’re currently architecting the microservices structure and designing technical support logistics and features, such as an elastic search and display functionality hosted on Amazon Web Services. With this in place, we’re building something which will allow us to pull in the right data to make critical decisions for our business model. We’re also writing scripts, running correlation analyses, and ensuring that we have statistical significance to make mission-critical decisions.
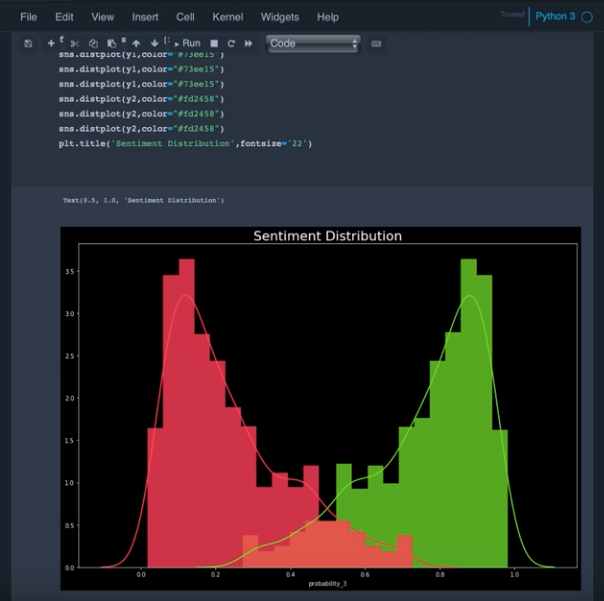
One of these critical decisions is how to design the flow of our product. To uncover consumer wants and determine what consumers would do once inside the product, we analyze common behavioral patterns in the data and map out the customer’s journey on our Customer Insights Map. We then align these typical behavioral patterns with our North Star metrics to determine how to design the business model and product to maximize future profitability. Throughout every development cycle, we keep one thing front of mind — to ensure we deliver the best overall experience for our end-user, aligning our company’s “why” with the emotional and logical triggers of our customer.
As you can imagine, this is a fluid process, and it will continue to be so throughout the duration of the product. As consumer behaviors shift, we’re able to move just as quickly without worrying that we’ll need to uproot the foundation of our program. By employing microservices and event-driven architecture, we will be able to go back in and make changes to the software as the need for transformation arises (and it will arise at some point), while simultaneously ensure we’re delivering the most personalized sublime experience to the end-user. We’ll do so by continuing to write scripts, run correlation analyses, and ensure we always have the statistical significance needed to validate major strategic shifts without sacrificing experience. Processes like these are critical to not making decisions based on a hunch or gut reaction, because in today’s climate that plan just won’t fly.
Conclusion
Whew! I told you it was going to be a doozy, didn’t I? I hope that I’ve persuaded you that Customer Journey Mapping, when done with excellence and rigor, in the way I’ve described in this post, is not only a worthwhile endeavor from an ROI perspective but also a massive competitive differentiator. In terms of innovation looping and mapping, the Customer Insights Map can be instrumental in surfacing and parsing out the best ideas to bring into your innovation meetings. All of this data can be quite telling across your entire ecosystem.
In terms of business transformation, digital transformation is not some fantastical, nefarious term or buzzword. Rooted in behavioral psychology and science, transformation initiatives have a much greater degree of success, particularly when you couple that science with advanced analytics and forward-thinking artificial intelligence. You better believe it — teams truly can develop experiences which are both humanistic and fully automated!
And that’s why our MasterClass Workshop on Modern Business Transformation, LevelNext was created.
We teach forward-thinking leaders the basis of the critical items needed for transformation. Even though we have additional layers of consultative and side-by-side mentorship or coaching, the content within LevelNext is designed to be foundational in nature. Once you go through LevelNext, you’ll quickly uncover the vast amount of additional specialties and specialists out there who can take you through additional training to deepen your skillset. For example, if you’re a growth engineer/marketer, you can take what you’ve learned in LevelNext and continue expanding your knowledge via Andrew Chen and Brian Balfour’s Reforge Growth Series. In this subset course, you’ll learn how to map this Customer Insights Map back to a cohort analysis via cohort retention analytics. You can also discover how to put those insights into an employee experience map within the Customer Insights Map.
Start here. Start with LevelNext, where you’ll get the foundational and critical tools, protocols, and frameworks to get to the point that you can learn a specific subset of knowledge, like that from Reforge, and implement it effectively. Without having these frameworks and protocols, you’ll continue to operate from a tactical level, which isn’t acceptable in today’s climate. Transformation requires a beautiful, sublime blend between strategy and tactician-level operationalization. We can help you get there.